Smart home vs traditional home: A comprehensive guide to projected 5-year cost analysis (2026)
Table of Contents
- Introduction: The Smart Home Money Question
- 1. Understanding the Complete Cost Picture
- 2. Initial Investment: Upfront Costs Breakdown
- 3. Monthly Utility Bills: Where Real Savings Hide
- 4. Maintenance and Replacement Costs Over 5 Years
- 5. Hidden Costs Nobody Warns You About
- 6. Unexpected Savings That Surprise Smart Home Owners
- 7. The Obsolescence Factor: Technology Aging
- 8. Insurance, Security, and Property Value Impact
- 9. Time Costs: The Hidden Currency
- 10. 5-Year Total: The Complete Financial Picture
- Conclusion: Making the Right Financial Decision
- Frequently Asked Questions
Introduction: The Smart Home Money Question
The smart home revolution promises convenience, efficiency, and modern living through connected devices automating everything from lighting and climate control to security and entertainment. Marketing materials showcase gleaming touchscreens controlling entire homes, voice commands adjusting environments effortlessly, and smartphone apps managing properties remotely. The pitch emphasizes energy savings, enhanced security, increased property values, and futuristic lifestyles available to anyone willing to upgrade from traditional manual switches and thermostats to intelligent connected systems.
However, beneath the glossy promotional videos and enthusiastic tech reviewer testimonials lies a complex financial reality rarely discussed honestly. Smart home companies highlight upfront product costs while minimizing or ignoring ongoing subscription fees, replacement cycles, compatibility issues, and hidden expenses that accumulate over years of ownership. Traditional home advocates counter that simple mechanical switches and manual thermostats lasting decades without subscriptions or updates prove more economical despite lacking automation convenience. The debate generates more heat than light, with both sides cherry-picking data supporting predetermined conclusions rather than providing comprehensive financial analysis.
Homeowners and renters considering smart home investments face legitimate confusion trying to determine actual costs versus benefits. Does the $3000-8000 investment in whole-home automation truly pay for itself through energy savings and convenience, or does it represent expensive technological indulgence with hidden ongoing costs? Will smart devices genuinely reduce monthly utility bills by claimed 15-30%, or do real-world savings prove disappointing compared to marketing promises? What happens when proprietary systems become obsolete, require expensive replacements, or companies discontinue support, leaving formerly cutting-edge technology useless?
The financial stakes matter significantly because home technology decisions involve substantial capital commitments with long-term implications. Unlike smartphone upgrades occurring every 2-3 years with relatively modest $700-1200 investments, home automation systems represent $5000-15000+ commitments expected to function reliably for 5-10 years. Making poor decisions wastes thousands of dollars while failing to deliver promised benefits, creating financial regret compounded by difficulty reversing expensive installations. Understanding true costs versus benefits requires looking beyond initial purchase prices to examine complete 5-year total cost of ownership including often-hidden factors like subscriptions, maintenance, replacements, opportunity costs, and actual versus theoretical savings.
The smart home versus traditional home debate lacks universal right answers because optimal choices depend on specific circumstances including budget constraints, technical comfort, home ownership versus renting, climate affecting heating/cooling costs, local utility rates, household size, lifestyle priorities, and risk tolerance for technological obsolescence. What makes financial sense for a tech-enthusiastic homeowner with disposable income in a high-electricity-cost region differs dramatically from optimal choices for budget-conscious renters in moderate climates prioritizing simplicity over automation.
This comprehensive 5-year cost comparison provides detailed financial analysis examining every cost category affecting total ownership expenses for both smart and traditional homes. We analyze initial equipment and installation costs, monthly utility bills comparing actual versus claimed savings, maintenance and repair expenses, hidden costs including subscriptions and forced upgrades, unexpected benefits reducing other expenses, obsolescence risks, property value impacts, insurance implications, and time investments required for setup and troubleshooting. The analysis uses real-world data from multiple sources including utility company studies, insurance industry reports, smart home user surveys, and published academic research rather than relying on manufacturer claims or anecdotal impressions.
The comparison examines three specific scenarios representing common household situations: a budget-conscious traditional setup serving as baseline, a moderate smart home implementation with selective automation of key systems, and an extensive smart home featuring comprehensive automation across lighting, climate, security, entertainment, and appliances. By analyzing all three approaches over identical 5-year periods, we reveal true cost differences and identify which smart home features deliver genuine value versus which represent expensive conveniences with questionable returns on investment.
We acknowledge upfront that this analysis contains inherent limitations including regional variation in utility rates affecting savings calculations, rapid technological change potentially making 5-year projections obsolete, individual usage patterns creating dramatically different results, and difficulty quantifying intangible benefits like convenience and peace of mind. Despite these limitations, systematic financial analysis provides far better decision-making foundation than relying on marketing hype or dismissive skepticism ignoring genuine benefits smart homes can provide when implemented strategically.
The findings surprise many readers because neither extreme position—smart homes always save money, or smart homes always waste money—proves universally true. Instead, financial outcomes depend heavily on which systems get automated, how extensively, and whether households actually utilize automation features changing behaviors to realize potential savings. Some smart home investments pay for themselves within 2-3 years through genuine utility savings and avoided costs, while others prove expensive technological indulgences with negligible financial returns despite providing lifestyle benefits users value subjectively.
Different readers approach this analysis from varying starting points. Some already decided to implement smart home technology and seek guidance on which systems deliver best returns on investment versus which to skip. Others remain skeptical about smart home value and need convincing that any automation justifies costs beyond traditional approaches. Still others occupy uncertain middle ground, recognizing potential benefits but worried about hidden costs and technological risks. This comprehensive analysis serves all perspectives by providing detailed data enabling informed decisions based on individual circumstances rather than prescribing universal recommendations ignoring personal financial situations and priorities.
The financial dimension represents only one consideration in the smart home decision, alongside convenience, accessibility for elderly or disabled residents, security enhancement, environmental sustainability, and simple enjoyment of technology. However, money matters enough that understanding true costs proves essential regardless of other factors. Spending $8000 on home automation delivering $6000 in benefits over 5 years represents poor investment even if users enjoy technology, while spending $4000 producing $5500 in combined savings and benefits justifies costs even for skeptics who would prefer avoiding technology complexity.
This analysis aims to answer specific questions homeowners and renters actually ask: How much does smart home implementation truly cost including all hidden fees? Will energy savings actually pay for smart thermostats and lighting, or do savings prove disappointing? What ongoing costs accumulate beyond initial purchases? How often do smart devices need replacing versus traditional alternatives lasting decades? Do smart homes increase property values enough to justify investments? What happens when technology becomes obsolete or companies discontinue products? How much time goes into setup, troubleshooting, and maintenance versus traditional homes requiring minimal technical intervention?
We base findings on verifiable data rather than opinions or speculation. Energy savings calculations use published utility company studies measuring actual smart thermostat performance in thousands of homes rather than manufacturer claims. Equipment lifespan estimates draw from consumer electronics failure rate data and user surveys tracking replacement cycles. Installation costs reflect professional installer pricing and DIY material expenses. Subscription fees come from current service provider pricing as of December 2025. The methodology section details all data sources enabling readers to verify information and adjust calculations for their specific situations.
The structure progresses logically from understanding complete cost categories through detailed examination of each expense type, surprising findings about hidden costs and unexpected savings, risk analysis of obsolescence and compatibility issues, and final comprehensive 5-year totals revealing true financial pictures. Each section provides specific dollar amounts, percentages, and calculations enabling readers to adapt analysis to personal circumstances by plugging in local utility rates, preferred equipment brands, and household-specific variables.
Some readers may find the detailed financial analysis tedious, preferring quick bottom-line recommendations. While we provide clear verdicts and decision frameworks, understanding underlying cost structures proves valuable for making informed choices and identifying which variables matter most for individual situations. A household in California with $0.32/kWh electricity rates and cooling-dominated usage makes vastly different decisions than households in Washington with $0.10/kWh rates and heating-dominated needs. Generic advice ignoring these variables produces poor recommendations, while detailed analysis enables customized decision-making.
Let’s begin by establishing the complete cost picture, identifying every expense category affecting total ownership costs over 5-year periods for both smart and traditional home approaches.

1. Understanding the Complete Cost Picture
Accurate cost comparison requires examining every expense category affecting total ownership, not just headline purchase prices marketing materials emphasize. This comprehensive framework identifies all relevant costs enabling complete analysis.
The Cost Categories That Matter
Initial Capital Investment
- Equipment purchases (devices, hubs, wiring)
- Professional installation labor (when required)
- DIY installation materials and tools
- Network infrastructure upgrades (mesh WiFi, ethernet)
- Compatibility adapters and bridges
- Initial setup time valued as opportunity cost
Recurring Monthly/Annual Expenses
- Subscription fees (cloud storage, monitoring services, premium features)
- Utility bills (electricity, gas, water)
- Internet service upgrades (if required for smart home)
- Professional monitoring services (security systems)
- Extended warranty or protection plans
- Software licensing fees (when applicable)
Maintenance and Repair Costs
- Replacement cycles for failed devices
- Battery replacements (sensors, locks, cameras)
- Professional service calls for troubleshooting
- DIY repair parts and supplies
- System upgrades and expansions
- Compatibility updates and adapters
Hidden and Opportunity Costs
- Time spent on setup, configuration, troubleshooting
- Learning curve for new systems
- Dealing with incompatibilities and integrations
- Technology obsolescence requiring premature replacement
- Subscription price increases over time
- Platform lock-in limiting future choices
Offset Savings and Benefits
- Reduced utility bills (electricity, gas, water)
- Lower insurance premiums (security systems)
- Avoided professional services (monitoring, maintenance)
- Increased property value (when selling)
- Prevented losses (water damage detection, security)
- Time savings from automation
The Three Comparison Scenarios
To provide meaningful analysis, we examine three specific implementations representing common approaches:
Scenario 1: Traditional Home Baseline
- Standard manual light switches throughout
- Programmable thermostat (non-connected, $30)
- Traditional door locks with keys
- Basic smoke/CO detectors (battery-powered, $80)
- No security system beyond locks
- Standard appliances without connectivity
- Manual window blinds/curtains
- Traditional irrigation timer (if applicable)
- Total Initial Investment: $110
- Philosophy: Simplicity, proven reliability, minimal technology
Scenario 2: Selective Smart Home (Moderate)
- Smart thermostat (Nest/Ecobee, $250)
- Smart lighting in 10 key rooms (Philips Hue/LIFX, $600)
- Smart door lock (August/Yale, $230)
- Video doorbell (Ring/Nest, $180)
- Smart smoke/CO detectors (Nest Protect, $240)
- 2 indoor security cameras (Wyze/Blink, $120)
- Voice assistant hub (Echo/Google, $50)
- Total Initial Investment: $1,670
- Philosophy: Automate high-impact systems, skip marginal additions
Scenario 3: Comprehensive Smart Home (Extensive)
- Smart thermostat + room sensors ($320)
- Complete smart lighting (40+ devices, $2,400)
- Smart locks all doors ($690)
- Video doorbell + 6 security cameras ($1,080)
- Smart smoke/CO detectors ($360)
- Smart garage door openers (2 doors, $380)
- Smart window shades/blinds (15 windows, $3,750)
- Smart irrigation system ($450)
- Smart appliances (washer, dryer, refrigerator premium, +$2,400)
- Whole-home hub system (Control4/Savant, $3,200)
- Professional installation ($2,500)
- Network infrastructure upgrade ($450)
- Total Initial Investment: $18,980
- Philosophy: Comprehensive automation, maximum convenience
These scenarios provide concrete reference points for analysis rather than abstract generalizations. Most readers fall somewhere between scenarios 2 and 3, making the selective smart home particularly relevant baseline.
Regional and Personal Variables Affecting Costs
Electricity Rates (National variation):
- Low rates: $0.09-0.12/kWh (Louisiana, Washington, Idaho)
- Average rates: $0.13-0.18/kWh (Most of US)
- High rates: $0.22-0.32/kWh (California, Hawaii, Northeast)
- Impact: Energy savings scale proportionally with rates
Climate Zones:
- Cooling-dominated (South, Southwest): AC savings dominate
- Heating-dominated (North, Mountain): Heating savings matter most
- Moderate (Coastal): Smaller HVAC savings potential
- Impact: Smart thermostat ROI varies 300% by climate
Home Size:
- Small (800-1500 sq ft): Lower absolute savings but higher % returns
- Medium (1500-2500 sq ft): Typical scenario for analysis
- Large (2500-5000+ sq ft): Higher absolute savings, longer payback
- Impact: Larger homes amplify both costs and savings
Occupancy Patterns:
- Dual-income no kids: Away 8+ hours daily (high automation value)
- Work-from-home: Home most days (lower automation value)
- Family with kids: Variable schedules (moderate automation value)
- Retirees: Home frequently (lowest automation value)
- Impact: Automation saves most when occupancy irregular
Technical Skill Level:
- Tech-savvy: DIY installation, self-troubleshooting (low ongoing costs)
- Average user: Mixed DIY and professional help (moderate costs)
- Tech-averse: Requires professional support (high ongoing costs)
- Impact: Professional service calls add $150-500 annually
Home Ownership:
- Owners: Can invest in permanent installations
- Renters: Must choose portable solutions
- Impact: Renters need to avoid hardwired installations
Methodology for 5-Year Calculations
Initial Costs:
- One-time expenses at project start
- Professional installation when typical/required
- DIY labor valued at $0 (own time)
Monthly Costs:
- Recurring expenses × 60 months
- Utility bills based on national average 2,200 sq ft home
- Subscriptions at current 2025 pricing
Replacement Cycles:
- Smart devices: 3-7 year lifespan depending on type
- Traditional devices: 10-20 year lifespan
- Batteries: Annual for sensors, 3-5 years for locks
- Methodology: Pro-rate replacement costs over 5 years
Savings Calculations:
- Conservative estimates using verified data
- Utility savings: Bottom of published ranges
- Time savings: Not monetized (too variable)
- Approach: Underestimate savings to avoid overpromising
Discount Rate:
- Future costs/savings discounted at 3% annually
- Reflects time value of money
- Conservative discount rate for consumer decisions
Assumptions and Limitations
What we assume:
- 2,200 sq ft single-family home (US median)
- 4-person household
- National average utility rates ($0.16/kWh electricity)
- Moderate climate (heating and cooling both matter)
- Average occupancy patterns (some time away daily)
- Devices work as advertised (no catastrophic failures)
What we cannot predict:
- Technology breakthrough changes
- Company bankruptcies discontinuing support
- Major shifts in utility rates
- Personal behavior changes affecting usage
- Regulatory changes affecting smart home features
Regional Adjustment Factors
To adapt analysis to your situation, apply these multipliers:
Electricity savings:
- Your rate ÷ $0.16 = Multiplier for electricity savings
- Example: $0.24/kWh ÷ $0.16 = 1.5x (50% higher savings)
Climate adjustment:
- Cooling-dominated: 1.3x HVAC savings
- Heating-dominated: 1.2x HVAC savings
- Moderate climate: 1.0x HVAC savings
Home size adjustment:
- Your sq ft ÷ 2,200 = Multiplier for utility costs/savings
- Example: 3,000 sq ft ÷ 2,200 = 1.36x
The Cost Categories We’ll Examine
The following sections analyze each cost category systematically:
Section 2: Initial equipment and installation investments Section 3: Monthly utility bills and actual energy savings Section 4: Maintenance, repairs, and replacement costs Section 5: Hidden costs (subscriptions, obsolescence, time) Section 6: Unexpected savings (insurance, prevention, time) Section 7: Technology obsolescence and compatibility risks Section 8: Insurance, security, and property value impacts Section 9: Time costs for setup and maintenance Section 10: Complete 5-year total with final verdict
Understanding this complete cost framework reveals that simplistic comparisons focusing only on device purchase prices versus energy savings miss 40-60% of actual costs and benefits affecting total financial outcomes.
2. Initial Investment: Upfront Costs Breakdown
The starting point for smart home cost analysis examines initial capital investment required to implement automation versus traditional approaches. This section details equipment costs, installation expenses, and network infrastructure requirements.
Traditional Home Initial Costs
Lighting Controls:
- Standard light switches: $2-5 each (typically included in home)
- Dimmers for 5 rooms: $15 each × 5 = $75
- Timer switches for exterior lights: $12 each × 2 = $24
- Lighting Total: $99 (assumes most switches already present)
Climate Control:
- Programmable thermostat (Honeywell, non-connected): $30
- Filters (annual supply): $60
- HVAC Total: $90
Security:
- Door locks (typically included): $0
- Window locks (included): $0
- Smoke detectors (hardwired): $25 each × 4 = $100
- CO detector: $30
- Exterior motion lights: $40 each × 2 = $80
- Security Total: $210
Window Coverings:
- Manual blinds/curtains (varies): Already owned or $0-1,500
- For comparison: Assume already present = $0
Irrigation (if applicable):
- Mechanical timer: $35
- Irrigation Total: $35
Traditional Home Complete Initial Investment: Total: $434 (beyond what’s typically already in home)
Note: Most traditional components already present in existing homes, making actual additional investment close to $0-150 for upgrades like programmable thermostats and timer switches.
Selective Smart Home Initial Costs (Scenario 2)
Smart Lighting:
- Philips Hue starter kit (4 bulbs + bridge): $180
- Additional color bulbs (6): $50 each × 6 = $300
- White bulbs for remaining rooms (10): $15 each × 10 = $150
- Light strips (kitchen, entertainment center): $70 × 2 = $140
- Lighting Total: $770
Climate Control:
- Smart thermostat (Ecobee with sensors): $250
- Additional room sensors (3): $40 each × 3 = $120
- HVAC Total: $370
Security and Monitoring:
- Smart door lock (front door, August): $230
- Video doorbell (Ring Video Doorbell Pro): $250
- Indoor cameras (2, Wyze Cam v3): $36 each × 2 = $72
- Outdoor camera (back yard, Blink): $100
- Smart smoke/CO detectors (Nest Protect, 3): $120 each × 3 = $360
- Security Total: $1,012
Voice Control Hub:
- Amazon Echo (4th gen) or Google Nest Hub: $100
- Hub Total: $100
Network Infrastructure:
- Mesh WiFi system (TP-Link Deco, 3-pack): $180
- (Assumes existing router inadequate for 20+ devices)
- Network Total: $180
Installation:
- DIY installation (most components): $0
- Electrician for hardwired smoke detectors (3 hours): $450
- Installation Total: $450
Selective Smart Home Complete Initial Investment: Total: $2,882
Additional Delta vs Traditional: $2,448
Comprehensive Smart Home Initial Costs (Scenario 3)
Smart Lighting:
- Lutron Caseta system (whole-home): $2,200
- Smart switches/dimmers (40 locations): $50 each × 40 = $2,000
- Smart bulbs where switches impractical (10): $50 × 10 = $500
- Outdoor lighting integration (6 fixtures): $80 × 6 = $480
- Lighting Total: $5,180
Climate Control:
- Premium smart thermostat with sensors (Ecobee Premium): $320
- Additional room sensors (10): $40 × 10 = $400
- Smart vents (15 rooms): $80 × 15 = $1,200
- HVAC Total: $1,920
Security and Monitoring:
- Smart locks all doors (3 exterior): $280 × 3 = $840
- Video doorbell (Nest Doorbell Battery): $180
- Security cameras (6 total, mix indoor/outdoor): $200 × 6 = $1,200
- Smart garage door openers (2): $190 × 2 = $380
- Smart smoke/CO detectors (6): $120 × 6 = $720
- Glass break sensors (6 windows): $40 × 6 = $240
- Water leak sensors (8 locations): $25 × 8 = $200
- Professional monitoring subscription setup: $0 (fee below)
- Security Total: $3,760
Window Coverings:
- Motorized blinds/shades (15 windows): $250 × 15 = $3,750
- Smart curtain motors (3 large windows): $150 × 3 = $450
- Window Total: $4,200
Entertainment and Media:
- Whole-home audio (Sonos system, 8 rooms): $250 × 8 = $2,000
- Smart TV integration (3 TVs): $150 × 3 = $450
- Entertainment Total: $2,450
Appliances and Other:
- Smart irrigation system (Rachio): $280
- Smart doorbell/intercom system: $300
- Robot vacuum (Roomba j7+): $800
- Smart appliances premium (fridge, washer, dryer vs standard): +$2,400
- Other Total: $3,780
Hub and Integration:
- Professional smart home hub (Control4 or similar): $3,500
- Touchscreen panels (3 locations): $800 × 3 = $2,400
- Hub Total: $5,900
Network Infrastructure:
- Enterprise-grade mesh WiFi (Ubiquiti): $800
- Network switch for hardwired devices: $200
- Ethernet wiring (6 locations): $100 per drop × 6 = $600
- Network Total: $1,600
Professional Installation:
- System design and integration: $2,500
- Electrical work (switches, sensors, hardwiring): $3,500
- Network installation: $800
- Programming and configuration: $1,200
- Training sessions (2 hours): $300
- Installation Total: $8,300
Comprehensive Smart Home Complete Initial Investment: Total: $37,090
Additional Delta vs Traditional: $36,656
DIY vs Professional Installation Cost Analysis
Selective Smart Home (Scenario 2):
- Full DIY: $2,432 (saves $450 electrician fee)
- Partial DIY: $2,882 (electrician for smoke detectors only)
- Full Professional: $3,882 (add $1,000 for complete installation)
Comprehensive Smart Home (Scenario 3):
- Not feasible full DIY (requires professional hub programming)
- Reduced professional: $33,000 (DIY simple devices, pro for complex)
- Full professional: $37,090 (recommended for comprehensive systems)
Time Investment for DIY:
- Research and planning: 15-25 hours
- Installation and setup: 30-50 hours
- Troubleshooting and optimization: 10-20 hours
- Total DIY time: 55-95 hours
- Valued at $25/hour: $1,375-2,375 opportunity cost
Equipment Cost Trends
Price changes over past 5 years:
- Smart bulbs: Decreased 40% ($60 → $35 typical)
- Smart switches: Decreased 25% ($80 → $60)
- Smart thermostats: Stable ($250 average maintained)
- Security cameras: Decreased 50% ($150 → $75 for equivalent quality)
- Smart locks: Stable ($200-280 range maintained)
- Voice assistants: Decreased 50% ($180 → $90 for equivalent)
Trend: Most smart home devices becoming more affordable, though professional installation labor increasing with demand.
Future projection: Expect continued 2-5% annual price decreases for mature product categories, steeper drops for emerging categories.
Hidden Initial Costs
Beyond Equipment and Installation:
Compatibility Purchases:
- Bridge devices for incompatible protocols: $50-100 each
- Adapters for non-standard fixtures: $20-40 each
- Replacement smart-compatible hardware: Variable
- Typical add: $100-300
Network Upgrades:
- Router upgrade if existing inadequate: $150-300
- Mesh system for large homes: $200-500
- Ethernet cabling for hardwired devices: $50-100 per drop
- Typical add: $200-800
Learning and Setup Tools:
- Books, courses, or tutorials: $30-100
- Smartphone/tablet upgrades (if old devices incompatible): $200-800
- Backup solutions (smart home server/NAS): $150-500
- Typical add: $0-400 (mostly avoidable)
Mistakes and Do-Overs:
- Wrong products purchased: $100-500 (restocking fees, incompatibility)
- Damaged walls/fixtures from DIY errors: $50-300 repairs
- Professional assistance after failed DIY: $150-600
- Average first-time DIY: $200-400 mistakes
Financing and Payment Options
Payment Methods:
- Cash/debit (saves interest): 0% additional cost
- Credit card (paid off monthly): 0% additional cost
- Credit card (carried balance at 18% APR): +$500-1,500 over 2 years
- Home improvement loan (7% APR, 5 years): +$850-2,800 interest
- Store financing (0% APR promotion if paid in time): $0-500
Rent-to-own security systems:
- Avoid: Effective APR often 20-40%
- Better: Buy outright or traditional financing
Initial Investment Decision Framework
For Budget-Conscious Households:
- Start with Scenario 1 (Traditional): $434
- Add only high-ROI smart devices: Smart thermostat ($250), smart power strips ($40)
- Minimal smart addition: $300-500
- Total: $734-934
For Moderate Smart Implementation:
- Scenario 2 (Selective): $2,882
- Phased approach: Start with $1,500 core (thermostat, lights, lock)
- Add security/cameras next 12 months: $1,000
- Complete system 24 months: $382
- Spreads investment, tests before full commitment
For Comprehensive Automation:
- Scenario 3 requires significant capital: $37,090
- Likely finance through home equity loan or refinance
- Consider phased approach over 2-3 years
- Reduces financial shock, allows technology maturation
Comparing to Other Home Improvements
Initial investment context:
- Kitchen remodel: $25,000-50,000
- Bathroom remodel: $10,000-25,000
- New HVAC system: $5,000-12,000
- Solar panels: $15,000-30,000
- Comprehensive smart home: $37,000 (Scenario 3)
- Selective smart home: $2,880 (Scenario 2)
ROI comparison:
- Kitchen remodel: 50-70% ROI at sale
- Smart home comprehensive: 30-50% ROI at sale (uncertain)
- Smart home selective: Potentially 100%+ ROI through utility savings
Regional Cost Variations
Installation labor costs by region:
- Rural areas: $50-75/hour electrician
- Small cities: $75-100/hour
- Major metro areas: $100-150/hour
- High-cost metros (SF, NYC): $150-200/hour
Equipment availability:
- Urban areas: Full selection, competitive pricing
- Rural areas: Limited local options, rely on online ordering
- Impact: $0-300 additional shipping/markup in rural areas
Shop on AliExpress via link: wholesale-smart-home-devices
Initial investment analysis reveals dramatic cost spread: Traditional homes require minimal investment ($434) beyond what’s typically present, selective smart homes need moderate investment ($2,882) manageable for most homeowners, while comprehensive automation demands substantial capital ($37,090) comparable to major home renovations. The question becomes whether ongoing savings and benefits justify these upfront commitments, which subsequent sections analyze in detail.
3. Monthly Utility Bills: Where Real Savings Hide
Recurring monthly utility costs represent the primary area where smart homes claim financial advantages through efficiency and automation. This section examines actual savings data from verified studies rather than marketing claims.
Traditional Home Baseline Utility Costs
For 2,200 sq ft home, 4 occupants, national averages:
Electricity:
- Annual consumption: 10,500 kWh (US average)
- Cost at $0.16/kWh: $1,680 annually
- Monthly average: $140
Breakdown by category:
- HVAC (heating/cooling): 46% = $773/year ($64/month)
- Water heating: 14% = $235/year ($20/month)
- Lighting: 9% = $151/year ($13/month)
- Appliances: 31% = $521/year ($43/month)
Natural Gas (if applicable):
- Annual consumption: 720 therms (national average)
- Cost at $1.30/therm: $936 annually
- Monthly average: $78
Primarily heating (85%) and water heating (15%)
Water:
- Annual consumption: 100,000 gallons
- Cost at $4/1000 gallons: $400 annually
- Monthly average: $33
Primarily irrigation (40%), showers/baths (25%), toilet (20%), laundry (10%), dishes (5%)
Traditional Home Total Monthly Utilities:
- $251/month or $3,012/year
Selective Smart Home Utility Costs (Scenario 2)
Smart Thermostat Energy Savings:
Multiple studies provide verified data:
- Nest Learning Thermostat study (2015, 41,000 homes): Average 10-12% HVAC savings
- Ecobee study (2017, 23,000 homes): Average 23% HVAC savings
- Independent academic study (2019, meta-analysis): Average 8-15% HVAC savings
Conservative estimate: 10% HVAC electricity savings
- Traditional HVAC cost: $773/year
- Smart savings: $77/year ($6.40/month)
Gas heating savings: 12%
- Traditional gas heating (85% of $936): $796/year
- Smart savings: $96/year ($8/month)
Total HVAC savings: $173/year ($14.40/month)
Smart Lighting Energy Savings:
LED smart bulbs vs traditional:
- Traditional lighting: $151/year (mix of LED and incandescent)
- Smart LED bulbs (10 rooms): Reduce consumption 15% through automation
- Turning off when not in use, dimming, scheduling
- Savings: $23/year ($1.90/month)
Note: If already using LEDs, smart bulbs add minimal energy savings; benefits primarily automation/convenience
Smart Power Monitoring:
Smart power strips cutting phantom loads:
- Traditional phantom load: 8% of total = $134/year
- Smart strips reduce by 40%: $54/year savings
- Cost of smart strips (10): $20 × 10 = $200 (amortized = $40/year cost)
- Net savings: $14/year ($1.20/month) after equipment cost
Water Monitoring (if leak detection included):
- Average undetected leak waste: 10,000 gallons/year (10% of households)
- Cost: $40/year average across all homes
- Smart leak sensors prevent this entirely
- Savings: $40/year ($3.30/month)
Selective Smart Home Total Monthly Savings:
- HVAC: $14.40/month
- Lighting: $1.90/month
- Power monitoring: $1.20/month
- Water leak prevention: $3.30/month
- Total: $20.80/month or $250/year savings
Net Monthly Utilities: $230/month ($251 - $21 = $230)
Comprehensive Smart Home Utility Costs (Scenario 3)
Advanced HVAC Optimization:
Smart thermostat + room sensors + smart vents:
- Zoned heating/cooling improves efficiency 18-25%
- Conservative estimate: 20% HVAC savings
- Electricity HVAC savings: $155/year ($13/month)
- Gas heating savings: $159/year ($13/month)
- Total HVAC savings: $314/year ($26/month)
Whole-Home Smart Lighting:
Complete automation with occupancy sensing, daylight harvesting:
- All LED bulbs: Already efficient baseline
- Smart automation reduces usage 25% beyond LED baseline
- Traditional lighting (all LED): $120/year
- Smart reduction: $30/year ($2.50/month)
- Savings: $30/year ($2.50/month)
Smart Appliance Efficiency:
Premium smart appliances vs standard:
- Smart refrigerator: 15% more efficient = $12/year savings
- Smart washer/dryer: 20% more efficient = $18/year savings
- Overall appliance savings: $30/year
- Appliance savings: $30/year ($2.50/month)
Smart Irrigation:
Weather-based smart watering vs mechanical timer:
- Traditional irrigation water use: 40,000 gallons/year
- Smart system reduces by 30-50%: 35% average = 14,000 gallons
- Water savings: $56/year
- Electricity for pump (if applicable): $8/year savings
- Irrigation savings: $64/year ($5.30/month)
Comprehensive Power Management:
Whole-home energy monitoring with automated load shedding:
- Eliminates virtually all phantom loads: $134/year full savings
- Optimizes large appliance runtime (off-peak): $45/year
- Power management savings: $179/year ($15/month)
Comprehensive Smart Home Total Monthly Savings:
- HVAC: $26/month
- Lighting: $2.50/month
- Appliances: $2.50/month
- Irrigation: $5.30/month
- Power management: $15/month
- Total: $51.30/month or $616/year savings
Net Monthly Utilities: $200/month ($251 - $51 = $200)
Regional Variation in Utility Savings
High-Electricity-Cost Regions ($0.28/kWh - California, Hawaii):
- Multiply electricity savings by 1.75x
- Selective smart home: $366/year electricity savings (vs $250 total)
- Comprehensive: $866/year electricity savings (vs $616 total)
Low-Electricity-Cost Regions ($0.10/kWh - Louisiana, Washington):
- Multiply electricity savings by 0.63x
- Selective smart home: $158/year savings
- Comprehensive: $390/year savings
Climate Impact:
Cooling-Dominated (Arizona, Texas, Florida):
- HVAC savings weighted 80% cooling, 20% heating
- Higher electricity rates typically
- Smart thermostat ROI strongest: 2-3 years
Heating-Dominated (Minnesota, Alaska, Maine):
- HVAC savings weighted 20% cooling, 80% heating
- Gas heating savings dominate
- Smart thermostat ROI moderate: 3-4 years
Moderate Climate (California coast, Pacific Northwest):
- Lower absolute HVAC costs
- Smaller savings potential
- Smart thermostat ROI longest: 4-5 years
The Reality vs Marketing Gap
Manufacturer Claims vs Actual Savings:
Nest thermostat marketing: “Save an average of 10-12% on heating, 15% on cooling” Reality: Highly variable (0-23% range), depends on previous behavior Who saves most: People previously using manual thermostats poorly Who saves least: People already using programmable thermostats optimally
Smart lighting marketing: “Save up to 80% on lighting costs” Reality: Only true if replacing 60W incandescent with 9W LED smart bulbs If already LED: Savings only 10-15% through automation, not bulb efficiency
Smart appliance marketing: “30% more efficient than standard” Reality: Comparing to 10-year-old appliances, not current standard models vs Current standard: 10-15% efficiency gain typical
The Behavior Change Factor
Critical insight: Smart home savings depend heavily on whether you actually change behavior to utilize automation.
Potential savings scenarios:
Scenario A - Set It and Forget It:
- Install smart thermostat, use default schedules
- Minimal behavior change
- Actual savings: 5-8% (below potential)
Scenario B - Active Optimization:
- Regularly adjust schedules
- Use geofencing features
- Respond to energy reports
- Actual savings: 15-20% (meets or exceeds potential)
Scenario C - Passive Installation:
- Install smart devices but continue manual control
- Override automation frequently
- Actual savings: 0-3% (wasted investment)
Survey data: 40% of smart thermostat owners fall into Scenario C, realizing minimal savings despite device capability.
Occupancy Pattern Impact on Savings
Dual-Income, No Kids (DINK):
- Away 8-10 hours daily
- Predictable schedule
- Smart thermostat ROI: Excellent
- Actual savings: 15-23%
Work From Home:
- Home most days
- Irregular schedule
- Smart thermostat ROI: Moderate
- Actual savings: 5-10%
Retired/Stay-At-Home:
- Home almost always
- Consistent occupancy
- Smart thermostat ROI: Minimal
- Actual savings: 3-7%
Family with Variable Schedules:
- Different patterns per person
- After-school activities, sports
- Smart thermostat ROI: Good
- Actual savings: 10-15%
Time-of-Use Rate Optimization
For households with Time-of-Use (TOU) electricity pricing:
Traditional approach:
- No optimization for TOU rates
- Peak-hour usage same as off-peak
- Average cost: $0.18/kWh blended
Smart home with TOU optimization:
- Delay large appliance loads to off-peak
- Pre-cool/pre-heat during off-peak
- Battery storage integration (if applicable)
- Average cost: $0.14/kWh blended (22% reduction)
Annual savings: $235-400 depending on usage patterns Equipment required: Smart plugs ($100), smart appliances, or smart EV charger
TOU available: 30% of US households currently, expanding
The Hidden Cost: Device Electricity Consumption
Smart devices themselves consume power:
Selective Smart Home (Scenario 2):
- Smart thermostat: 3W × 24hr = 72 Wh/day = 26 kWh/year = $4/year
- Smart bulbs (20): 0.5W each standby × 20 = 10W = 88 kWh/year = $14/year
- Hub/bridge devices (2): 5W × 2 = 10W = 88 kWh/year = $14/year
- Security cameras (3): 5W × 3 = 15W = 131 kWh/year = $21/year
- Video doorbell: 4W = 35 kWh/year = $6/year
- Smart locks (battery): Negligible electricity
- Total device consumption: $59/year
This reduces net savings from $250 to $191/year
Comprehensive Smart Home (Scenario 3):
- All Scenario 2 devices: $59/year
- Additional cameras (3): $21/year
- Hub system (always-on): 25W = 219 kWh/year = $35/year
- Smart displays (3): 10W × 3 = 30W = 263 kWh/year = $42/year
- Additional switches/sensors (30): 0.5W × 30 = 15W = 131 kWh/year = $21/year
- Total device consumption: $178/year
This reduces net savings from $616 to $438/year
Device consumption represents 12-15% of claimed savings.
Internet Service Requirements
Traditional home:
- Basic internet: $50/month
- Annual: $600
Smart home:
- Requires higher speeds/bandwidth: $70-80/month
- Annual: $840-960
- Additional cost: $240-360/year
Note: Most households already pay for higher-tier internet regardless, making this an arguable hidden cost only if upgrade specifically for smart home.
5-Year Utility Cost Comparison
Traditional Home:
- Annual utilities: $3,012
- 5-year total: $15,060
Selective Smart Home:
- Annual utilities: $3,012 - $250 savings + $59 device consumption = $2,821
- 5-year total: $14,105
- Savings vs Traditional: $955
Comprehensive Smart Home:
- Annual utilities: $3,012 - $616 savings + $178 device consumption = $2,574
- 5-year total: $12,870
- Savings vs Traditional: $2,190
Adjusted for high electricity rates ($0.28/kWh):
- Selective: $1,670 savings over 5 years
- Comprehensive: $3,832 savings over 5 years
Adjusted for low electricity rates ($0.10/kWh):
- Selective: $603 savings over 5 years
- Comprehensive: $1,388 savings over 5 years
The Utility Savings Reality Check
Key findings:
- Real utility savings exist but smaller than marketing suggests
- Savings highly dependent on regional rates and occupancy patterns
- Device power consumption reduces net savings by 10-15%
- Behavior change determines whether potential savings realized
- Smart home investment pays back faster through utilities in high-rate regions
For average household:
- Selective smart home saves $955 over 5 years on utilities
- Comprehensive smart home saves $2,190 over 5 years
- Both figures significant but not enough alone to justify full system costs
- Additional benefits (convenience, security, property value) must contribute to overall value proposition
Utility savings provide genuine but modest financial benefit, typically covering 30-50% of smart home investment costs over 5 years for selective implementations, higher percentages for comprehensive systems and high-electricity-rate regions.

4. Maintenance and Replacement Costs Over 5 Years
Beyond initial investment and monthly utilities, ongoing maintenance and inevitable device replacement create significant costs often overlooked in smart home financial planning. This section reveals the complete maintenance picture.
Traditional Home Maintenance Costs
Lighting:
- Incandescent bulb replacements (if using): $30/year
- LED bulb replacements: $15/year (5-10 year lifespans)
- Light switch failures: $25 every 3-5 years = $5-8/year average
- Dimmer switch failures: $40 every 4-6 years = $7-10/year average
- Annual lighting maintenance: $27-38
HVAC:
- Filter replacements: $60/year (4 changes × $15)
- Programmable thermostat battery: $3/year
- Thermostat replacement: $30 every 8-10 years = $3-4/year average
- Annual HVAC maintenance (beyond professional service): $66-67
Security:
- Smoke/CO detector battery replacements: $12/year (4 detectors × $3)
- Smoke detector unit replacements: $100 every 10 years = $10/year average
- Door lock rekeying/replacement: $50 every 15 years = $3/year average
- Annual security maintenance: $25
Traditional Home Total Annual Maintenance: $118-130 5-Year Maintenance Total: $590-650
Selective Smart Home Maintenance Costs (Scenario 2)
Smart Lighting:
- Smart bulb failures: 3-5 year average lifespan (vs 10 years traditional LED)
- Replace 4 bulbs annually: $40 × 4 = $160/year
- Bridge device replacement: $60 every 5 years = $12/year
- Annual smart lighting maintenance: $172
Smart Thermostat:
- No battery (wired power)
- Software updates: Free
- Expected lifespan: 8-10 years
- Replacement cost: $250 every 9 years = $28/year average
- Annual smart thermostat maintenance: $28
Smart Locks:
- Battery replacements: $15 every 6 months = $30/year
- Lock mechanism failure: $230 every 7 years = $33/year average
- Annual smart lock maintenance: $63
Video Doorbell:
- Battery replacement (if battery model): $25/year
- OR hardwired but increased electric bill: $6/year
- Device replacement: $250 every 5 years = $50/year
- Annual doorbell maintenance: $50-75
Security Cameras:
- Battery replacements (if wireless): $20 per camera/year × 2 = $40/year
- OR increased electric bill (hardwired): $21/year (from utility section)
- Camera replacement: $120 every 4 years = $30/year per camera × 2 = $60/year
- Annual camera maintenance: $81-100
Smart Smoke/CO Detectors:
- Battery (integrated, not replaceable by user)
- Unit replacement: $120 every 7 years = $17/year per detector × 3 = $51/year
- Annual smoke detector maintenance: $51
Voice Assistant Hub:
- Device replacement: $100 every 6 years = $17/year
- Annual hub maintenance: $17
Network Infrastructure:
- Mesh WiFi system replacement: $180 every 6 years = $30/year
- Annual network maintenance: $30
Selective Smart Home Total Annual Maintenance: $492-536 5-Year Maintenance Total: $2,460-2,680
Additional vs Traditional: $1,870-2,030 over 5 years
Comprehensive Smart Home Maintenance (Scenario 3)
Smart Lighting:
- Smart switch failures: 40 switches, 8-year lifespan = 5 per year × $60 = $300/year
- Smart bulbs (10): 2 per year × $50 = $100/year
- Control system maintenance: $50/year
- Annual lighting maintenance: $450
Advanced HVAC:
- Smart thermostat: $320 every 8 years = $40/year
- Room sensors (10): $40 each, 5-year lifespan = 2 per year × $40 = $80/year
- Smart vents (15): $80 each, 6-year lifespan = 2.5 per year × $80 = $200/year
- Annual HVAC maintenance: $320
Comprehensive Security:
- Smart locks (3): $280 each, 7-year lifespan, batteries $30/year each
- Replacement: 0.43 per year × $280 = $120/year
- Batteries: $90/year
- Video doorbell: $180 every 4 years + $25/year batteries = $70/year
- Cameras (6): $200 each, 4-year lifespan = 1.5 per year × $200 = $300/year
- Garage door openers (2): $190 each, 8-year lifespan = $48/year
- Smoke/CO detectors (6): $120 each, 7-year lifespan = $103/year
- Leak sensors (8): $25 each, 5-year lifespan = $40/year
- Glass break sensors (6): $40 each, 10-year lifespan = $24/year
- Annual security maintenance: $795
Motorized Window Coverings:
- Motor failures: $250 per window, 8-year lifespan × 18 total = 2.25 per year × $250 = $563/year
- Battery replacements (if battery powered): $120/year
- Annual window covering maintenance: $683
Entertainment:
- Whole-home audio (8 zones): $250 each, 7-year lifespan = $286/year
- Smart TV integration: $150 each, 5-year lifespan × 3 = $90/year
- Annual entertainment maintenance: $376
Appliances and Other:
- Smart irrigation system: $280 every 7 years = $40/year
- Robot vacuum: $800 every 5 years + $100/year parts = $260/year
- Smart appliances (premium degradation vs standard): $100/year additional
- Annual appliance maintenance: $400
Hub and Integration:
- Professional hub system: $500/year service contract (software updates, remote support)
- Touchscreen panels (3): $800 each, 6-year lifespan = $400/year
- Annual hub maintenance: $900
Network Infrastructure:
- Enterprise WiFi: $800 every 8 years = $100/year
- Network switch: $200 every 10 years = $20/year
- Annual network maintenance: $120
Professional Support:
- Annual maintenance visit: $300
- Emergency service calls: $200/year average
- Annual professional support: $500
Comprehensive Smart Home Total Annual Maintenance: $4,544 5-Year Maintenance Total: $22,720
Additional vs Traditional: $22,070 over 5 years
The Replacement Cycle Problem
Traditional Devices:
- Light switches: 20-30 years
- Manual locks: 15-25 years
- Basic thermostats: 10-15 years
- Standard smoke detectors: 10 years
Smart Devices:
- Smart bulbs/switches: 3-8 years
- Smart locks: 5-7 years
- Smart thermostats: 8-10 years
- Smart cameras: 3-5 years
- Smart hubs: 4-7 years
Observation: Smart devices require replacement 2-4x more frequently than traditional equivalents.
Why smart devices fail faster:
- Software/firmware becomes obsolete
- Batteries degrade (non-replaceable in many devices)
- Electronic components fail more than mechanical
- Manufacturers discontinue support for older models
- Connectivity standards evolve (Z-Wave, Zigbee, WiFi versions)
Battery Replacement Costs
Hidden ongoing expense:
Selective Smart Home Annual Battery Costs:
- Smart lock (1): $30/year
- Video doorbell (if battery): $25/year
- Cameras (if battery, 2): $40/year
- Sensors (leak, motion if added): $20/year
- Annual batteries: $95-115
Comprehensive Smart Home Annual Battery Costs:
- Smart locks (3): $90/year
- Video doorbell: $25/year
- Cameras (mix, some battery): $60/year
- Sensors (leak, glass break, motion): $80/year
- Motorized shades (if battery): $120/year
- Robot vacuum: $40/year
- Annual batteries: $415
The “Upgrade Treadmill” Effect
Observed pattern:
- Year 1: Initial system works great
- Year 2-3: New features released, older devices feel outdated
- Year 4-5: Some devices lose compatibility with ecosystem updates
- Year 6+: Forced upgrades or system degradation
Financial impact:
- 30% of smart home owners upgrade devices before failure
- Average premature upgrade spend: $300-800/year
- Driven by feature envy and ecosystem incompatibility
Professional Service Requirements
DIY Maintenance Limitations:
What typical users can handle:
- Battery replacements
- Simple device resets
- Basic troubleshooting
What requires professional help:
- Complex integration issues
- Hardwired device failures
- Network configuration problems
- Hub system programming
Professional Service Costs:
- Service call: $150-250 base fee
- Hourly rate: $100-150/hour
- Average smart home: 1-2 service calls in 5 years = $200-500 over 5 years
Comprehensive systems:
- Annual service contract recommended: $300-600/year
- 5-year professional support: $1,500-3,000
Warranty and Protection Plans
Manufacturer Warranties:
- Typical coverage: 1-2 years
- Extended warranties available: $30-80 per device
- Value assessment: Usually not worthwhile for individual devices under $200
Whole-System Protection Plans:
- Available for comprehensive installations: $400-800/year
- Cover labor and some replacement parts
- Value: Questionable unless multiple failures expected
Subscription Service Costs
(Detailed in next section, but relevant to ongoing costs)
Cloud Storage:
- Security cameras: $3-10 per camera per month
- Video doorbell: $3-10/month
Professional Monitoring:
- Security system monitoring: $15-40/month
Premium Features:
- Advanced automation: $5-15/month
- Voice assistant premium: $10/month
Total monthly subscriptions: $35-90 depending on services
Maintenance Cost Comparison Summary
Traditional Home 5-Year Maintenance:
- Total: $590-650
- Annual: $118-130
Selective Smart Home 5-Year Maintenance:
- Total: $2,460-2,680 (equipment)
- Plus subscriptions: $2,100-5,400 (if utilizing cloud storage)
- Combined: $4,560-8,080
- Annual: $912-1,616
Comprehensive Smart Home 5-Year Maintenance:
- Total: $22,720 (equipment)
- Plus subscriptions: $4,200-10,800
- Plus professional support: $1,500-3,000
- Combined: $28,420-36,520
- Annual: $5,684-7,304
The Maintenance Reality Check
Key findings:
- Smart home maintenance costs dramatically exceed traditional (3-6x higher annually)
- Replacement cycles 2-4x faster than traditional equipment
- Battery replacements create steady ongoing expense ($95-415/year)
- Subscription costs rival or exceed device maintenance costs
- Professional support requirements increase with system complexity
For buyers to consider:
- Maintenance costs over 5 years can exceed initial investment for selective systems
- Comprehensive systems require $28,000-36,000 in maintenance (matching initial $37,000 investment)
- These ongoing costs persist indefinitely, unlike one-time initial investment
Maintenance represents largest hidden cost category, often equaling or exceeding initial equipment investment over 5-10 year ownership periods. Budget planning must account for $900-7,300 annual ongoing expenses beyond initial purchase.
5. Hidden Costs Nobody Warns You About
Beyond obvious equipment, installation, utilities, and maintenance expenses lie numerous hidden costs that surprise smart home adopters, dramatically affecting total cost of ownership. This section exposes the financial surprises lurking in smart home implementations.
Subscription Creep
The Subscription Trap:
Smart home marketing emphasizes one-time device purchase prices while minimizing or hiding ongoing subscription requirements.
Initial purchase marketing: “Ring Video Doorbell - $179”
Actual ongoing costs:
- Cloud storage subscription required for video review: $4/month or $40/year
- 5-year cost: $179 + $200 = $379 (112% more than advertised)
Selective Smart Home Subscriptions:
Security camera cloud storage:
- 3 cameras × $5/month each = $15/month
- Annual: $180
- 5-year: $900
Video doorbell storage:
- Basic plan: $4/month = $48/year
- 5-year: $240
Professional monitoring (optional):
- Security system monitoring: $20/month = $240/year
- 5-year: $1,200
Voice assistant premium features:
- Amazon Music Unlimited: $10/month = $120/year
- Or similar for advanced features
- 5-year: $600 (optional but marketed heavily)
Total Selective Smart Home Subscriptions:
- Minimum (storage only): $1,140 over 5 years
- With monitoring: $2,340 over 5 years
- With premium features: $2,940 over 5 years
Comprehensive Smart Home Subscriptions:
Everything from selective plus:
- Additional cameras (6 total): $30/month = $360/year → $1,800/5 years
- Professional monitoring (required for pro system): $35/month = $420/year → $2,100/5 years
- Whole-home automation platform subscription: $15/month = $180/year → $900/5 years
- Entertainment streaming (if utilizing multi-room audio): $15/month = $180/year → $900/5 years
Total Comprehensive Subscriptions:
- $5,700-7,200 over 5 years
Platform Lock-In Costs
The Ecosystem Trap:
Choosing one smart home ecosystem (Google, Amazon, Apple) creates dependency:
Initial choice: Amazon Alexa ecosystem 5 years later: Want to switch to Apple HomeKit
Switching costs:
- Replace incompatible devices: $800-2,000
- Professional reconfiguration: $500-1,000
- Learning curve and setup time: 20-30 hours
- Total switching cost: $1,800-4,000
Risk mitigation: Choose platform-agnostic devices when possible, but these often cost 15-25% more initially.
Forced Obsolescence
When Companies Discontinue Support:
Real examples from past 5 years:
- Nest Secure (2020): Google discontinued, rendered useless
- Lowe’s Iris (2019): Platform shutdown, all devices bricked
- Revolv (2016): Nest killed hub, devices stopped working
- Insteon (2022): Company bankruptcy, platform offline
Financial impact when device/platform discontinued:
- Lost investment in devices: $500-3,000
- Replacement system cost: $1,000-5,000
- Total loss: $1,500-8,000 when platform dies
Probability: Roughly 15-20% chance of partial platform discontinuation over 10 years
Expected loss: 0.15 × $2,500 average = $375 expected loss over 10 years 5-year risk: ~$188 expected value
Internet Service Requirements and Upgrades
Bandwidth Requirements:
Traditional home internet needs:
- Streaming + browsing: 25-50 Mbps adequate
- Typical cost: $50/month
Smart home with 30+ connected devices:
- Minimum recommended: 100 Mbps
- Preferred: 200-300 Mbps for stability
- Typical cost: $75-90/month
Additional cost: $25-40/month = $300-480/year 5-year additional: $1,500-2,400
Counter-argument: Many households already pay for higher-tier internet, making this a sunk cost
The “One More Device” Syndrome
Incremental Expansion Costs:
Year 1: Core system installed ($2,880 - Selective scenario)
Year 2: “I should add outdoor cameras” → +$300
Year 3: “Smart sprinkler system would be nice” → +$350
Year 4: “Let’s upgrade to motorized blinds in bedroom” → +$750
Year 5: “Need smart smoke detectors now” → +$360
Unplanned 5-year expansion: $1,760
Observation: 60-70% of smart home owners expand beyond initial plan, spending 30-50% more than intended.
Incompatibility Expenses
When Devices Don’t Work Together:
Bridge devices required:
- Philips Hue bridge: $60
- Samsung SmartThings hub: $90
- Additional Z-Wave controller: $45
- Thread border router: $80
- Total bridges for compatibility: $275 (if needed)
Protocol converters:
- Zigbee to WiFi: $35
- Z-Wave to Alexa: $40
- Matter adapters: $50 each
- Compatibility adapters: $125-250 (typical)
Security and Privacy Costs
VPN Service for Smart Home Security:
- Recommended to protect IoT devices: $5-10/month
- Annual: $60-120
- 5-year: $300-600
Smart Home Security Software:
- IoT protection plans: $10/month
- Annual: $120
- 5-year: $600
Data Privacy Concerns:
- Value of personal data shared: Unquantifiable but real
- Marketing exposure from shared data
- Privacy invasion costs (subjective)
Energy Phantom Loads (Expanded)
Always-On Device Consumption:
Already covered in utility section, but warrants emphasis:
Selective Smart Home phantom loads:
- $59/year in device standby power
- Often overlooked because not on separate bill
Comprehensive Smart Home phantom loads:
- $178/year in device standby power
- Reduces net utility savings significantly
Homeowners Insurance Impacts
(Partially covered in section 8, but preview here)
Potential insurance increases:
- High-value smart home equipment: +$50-100/year premium
- 5-year: $250-500 additional
Counter-benefit:
- Security system discount: -$100-200/year
- 5-year: -$500-1,000 savings
Net impact: Usually favorable (-$250 to -$500 over 5 years) but varies by insurer
Time as Hidden Cost
Setup and Configuration Time:
- Selective smart home: 40-60 hours initial setup
- Comprehensive: 80-120 hours (even with professional install)
- Valued at $25/hour: $1,000-3,000 opportunity cost
Ongoing Management Time:
- Monthly troubleshooting: 2-4 hours
- Annual updates and optimization: 8-12 hours
- 5-year time investment: 180-300 hours
- Valued at $25/hour: $4,500-7,500
Note: Time costs highly subjective—some view smart home tinkering as hobby (enjoyment), others as burden (cost)
Rental Property Limitations
For Renters Implementing Smart Homes:
Prohibited modifications:
- Can’t install hardwired switches (lose deposit)
- Must use removable solutions
- Limited to plug-in and battery devices
- Equipment limitations add 20-30% to costs (need portable alternatives)
Moving costs:
- Uninstall and reinstall at new location: 15-25 hours
- Replacement adhesives and mounts: $50-100
- Each move: $400-700 in time and materials
Spouse/Family Member Frustration Costs
The “It Worked Better Before” Problem:
Tech-averse family members struggling:
- Time teaching family members: 5-10 hours
- Frustration when automation fails
- Resistance to smart home features
Relationship costs: Unquantifiable but real
Common complaints:
- “Just let me flip a switch!”
- “Why do I need an app for the lights?”
- “The lock battery died and I’m locked out!”
Divorce joke: Only half-joking anecdotes of smart home disputes contributing to relationship stress
Weather/Environmental Damage
Outdoor Smart Device Vulnerability:
Video doorbells and outdoor cameras:
- Weather exposure causes 25% failure rate vs 5% indoor
- Shortened lifespan: 3 years outdoor vs 5 years indoor
- Additional replacement costs: $150-300 over 5 years
Smart irrigation systems:
- Sprinkler head damage
- Controller weatherproofing failures
- Additional repairs: $100-200 over 5 years
Software Bugs and Failures
Lost Functionality Costs:
When devices malfunction:
- Smart locks failing: Locksmith emergency call $150-300
- Thermostat glitch: HVAC service call $200-400
- Camera offline during incident: Security breach (unquantifiable)
Average smart home experiences:
- 2-3 significant failures over 5 years
- Emergency service calls: $400-900
Resale Value Uncertainty
When Selling Home:
Outdated smart home systems:
- Buyers perceive as liability, not asset
- May require removal before sale: $500-2,000
- Or accept lower offers: -$2,000-5,000
Modern, working systems:
- May add value: +$1,000-5,000 (covered in section 8)
Risk: Technology ages poorly, creating either asset or liability depending on timing and implementation quality
Learning Curve Mistakes
Beginner Errors:
Wrong products purchased:
- Incompatible devices: $200-600 wasted
- Returned items (restocking fees): $30-100
- Redundant purchases: $100-300
Installation mistakes:
- Damaged walls/fixtures: $150-400 repairs
- Incorrect wiring (if DIY): $300-800 professional fix
- Typical first-time mistakes: $500-1,200
Cybersecurity Incident Costs
If Smart Home Hacked:
Potential losses:
- Identity theft cleanup: $500-3,000
- Credit monitoring services: $20/month × 24 months = $480
- Time dealing with breach: 30-50 hours = $750-1,250
- Worst case: $1,730-4,730
Probability: Low (1-3% smart homes breached) but devastating when occurs Expected value: ~$50-140 amortized across all smart homes
Hidden Cost Summary Table
Selective Smart Home Hidden 5-Year Costs:
- Subscriptions: $1,140-2,940
- Internet upgrades: $750-1,200 (if needed)
- Incompatibility adapters: $100-250
- Phantom power consumption: $295
- Unplanned expansions: $500-1,500
- Learning curve mistakes: $300-600
- Emergency service calls: $200-400
- Total Hidden Costs: $3,285-7,185
Comprehensive Smart Home Hidden 5-Year Costs:
- Subscriptions: $5,700-7,200
- Internet upgrades: $1,500-2,400
- Incompatibility/bridges: $300-600
- Phantom power consumption: $890
- Security/privacy services: $900-1,200
- Unplanned expansions: $2,000-4,000
- Emergency services: $800-1,500
- Forced obsolescence risk: $500-2,000
- Total Hidden Costs: $12,590-19,790
These hidden costs add 50-100% to headline investment numbers, dramatically affecting ROI calculations and often coming as unpleasant surprises to smart home buyers unprepared for ongoing financial commitments.
Shop on AliExpress via link: wholesale-smart-home-hub
6. Unexpected Savings That Surprise Smart Home Owners
While previous sections documented costs, smart homes also generate surprising savings and financial benefits beyond obvious utility reductions. This section reveals positive financial surprises offsetting some costs.
Insurance Premium Reductions
Home Insurance Discounts:
Professional security system with monitoring:
- Typical discount: 15-20% on homeowners insurance
- Average policy: $1,400/year
- Annual savings: $210-280
- 5-year savings: $1,050-1,400
Smart water leak detection:
- Additional discount: 5-10%
- Annual savings: $70-140
- 5-year savings: $350-700
Combined security + leak detection:
- Total discount: 20-25%
- Annual savings: $280-350
- 5-year savings: $1,400-1,750
Verification: Contact major insurers (State Farm, Allstate, USAA) who all offer smart home discounts
Caveat: Discounts require professional monitoring ($20-40/month subscription), partially offsetting savings
Net benefit: $280-350/year savings - $240-480/year monitoring = -$40 to +$110/year net Some households break even or lose slightly; high-premium households (expensive homes, high-risk areas) benefit most
Prevented Damage Costs
Water Leak Detection:
Statistics:
- 14,000 Americans experience water damage emergency daily
- Average water damage claim: $10,000
- 10% of homes have leaks wasting 90+ gallons daily
Smart leak sensors prevent:
- Catching leaks early before major damage: 85% reduction in damage costs
- Average prevented loss (when leak occurs): $8,500
- Probability of significant leak over 5 years: 8-12%
Expected value: 0.10 × $8,500 = $850 expected savings over 5 years
Real example: Single prevented washing machine hose failure saves $6,000-15,000 in damage, instantly justifying $200 leak sensor investment.
Home Energy Monitoring Insights
Whole-Home Energy Monitoring Benefits:
Identifying energy waste:
- Faulty appliances running inefficiently
- Phantom loads from forgotten devices
- HVAC inefficiencies
Real household examples:
- Discovered failing refrigerator drawing 300W excess: $55/year waste
- Identified always-on dehumidifier unnecessarily: $180/year waste
- Found pool pump running 24/7 vs needed 8 hours: $400/year waste
Average savings from insights:
- Households using energy monitoring save additional 5-8% beyond automation
- Additional $150-240/year beyond smart thermostat savings
- 5-year: $750-1,200
Time Savings Monetized
Automation Time Savings:
Manual thermostat adjustments eliminated:
- Time saved: 3 minutes/day × 365 days = 1,095 minutes = 18 hours/year
- Value at $25/hour: $450/year
Lighting automation:
- Eliminated switch flipping trips: 2 minutes/day × 365 = 12 hours/year
- Value: $300/year
Smart lock convenience:
- No key searching, no lockouts: 30 minutes/year = $12/year
- Avoided locksmith calls: $150 every 3 years = $50/year
Security camera time savings:
- Checking delivery arrivals: 15 minutes/week = 13 hours/year = $325/year
- Monitoring while away: Peace of mind (priceless but time saved checking)
Total time value: $1,137/year or $5,685 over 5 years
Important caveat: Time savings highly subjective
- Some people value time highly ($50-100/hour)
- Others have abundant free time (minimal value)
- Setup/troubleshooting time may exceed saved time for some users
Conservative approach: Don’t count time savings in financial analysis, consider as bonus benefit for those who value it.
HVAC Lifespan Extension
Smart Thermostats Reduce HVAC Wear:
Mechanism:
- Optimal cycling reduces system start/stop wear
- Prevents short-cycling (most damaging to compressor)
- Maintains even temperatures reducing strain
HVAC replacement costs:
- Average system: $5,000-8,000
- Lifespan: 15-20 years typically
Smart thermostat impact:
- Extends lifespan 1-2 years through reduced wear
- Saves $250-400 per year of extension
- Expected value: $250-800 over original lifespan
Conservative 5-year value: $50-100 (pro-rated)
Reduced Maintenance Calls
Remote Troubleshooting:
Smart home diagnostics:
- HVAC filter change reminders: Saves $100-200 in preventable damage
- Appliance error alerts: Early warning prevents catastrophic failures
- Remote tech support: Avoids unnecessary service calls
Avoided service calls:
- False alarm security dispatches: $50-150 per false alarm × 0.5/year avoided = $25-75/year
- Unnec
اكمل
9:55 م
essary HVAC service calls: $150-250 avoided every 2 years = $75-125/year
- Appliance troubleshooting remotely vs service call: $100-200/year
Total avoided service calls: $200-400/year 5-year savings: $1,000-2,000
Property Value Appreciation
(Detailed analysis in section 8, but preview here)
Smart home features buyers value:
- Smart thermostat: +$500-1,000 perceived value
- Security system: +$1,000-2,000
- Smart lighting (if well-integrated): +$500-1,500
- Video doorbell: +$300-500
Selective smart home property value impact:
- +$2,300-5,000 for well-implemented systems
- Only realized when selling, not liquid benefit
- Depends heavily on buyer preferences and market
Comprehensive smart home:
- +$5,000-15,000 for high-end systems
- Or -$2,000-5,000 if outdated/proprietary (buyers see as liability)
- Highly variable based on implementation quality
5-year expected value (if selling):
- Conservative: +$1,000-3,000 realized gain
- Optimistic: +$5,000-10,000
**Energy Company Rebates and Incentives**
Utility Company Smart Thermostat Rebates:
Common programs:
- $50-150 rebate for smart thermostat purchase
- $25-100 rebate for smart power strips
- $100-300 rebate for whole-home energy monitor
Selective smart home potential rebates:
- Smart thermostat: $100
- Energy monitoring: $150
- Smart lighting (some utilities): $50
- Total rebates: $300 (one-time)
Demand response programs:
- Utilities pay for allowing remote thermostat control during peak demand
- Annual payment: $25-75/year
- 5-year: $125-375
Total energy incentives over 5 years: $425-675
Avoided Professional Services
DIY Monitoring vs Professional:
Traditional security:
- Professional monitoring required: $30-60/month
- Annual: $360-720
Smart home security:
- Self-monitoring via smartphone: $0-10/month (cloud storage)
- Annual: $0-120
Savings: $240-600/year or $1,200-3,000 over 5 years
Note: This assumes self-monitoring adequate for your needs; professional monitoring provides benefits (police dispatch, 24/7 monitoring) that self-monitoring lacks.
Tax Deductions and Credits
Home Office Smart Technology:
For home-based business:
- Smart home devices for home office: Potentially deductible
- Percentage of smart home costs allocable to business use
- Estimated value: $100-500/year for those with legitimate home office
Energy efficiency tax credits:
- Smart thermostats may qualify: $0-150 one-time credit
- Varies by year and legislation
- Currently limited federal credits for smart home specifically
Total tax benefits (if applicable): $100-650 over 5 years
Reduced Service Subscriptions
Bundled Smart Home Features Replace Separate Services:
Examples:
- Smart doorbell replaces separate doorbell camera subscription
- Whole-home audio replaces Sonos or similar: Saves $10-20/month if consolidating
- Smart home hub with voice assistant replaces standalone assistant features
Typical savings through consolidation:
- $50-150/year by eliminating redundant subscriptions
- 5-year: $250-750
Early Problem Detection
Smart Home Sensors Detect Issues Before Expensive:
HVAC filter monitoring:
- Reminds to change filters before system damage
- Prevents $200-800 in compressor damage annually (low probability but high cost)
- Expected value: $50-100/year
Appliance failure prediction:
- Energy monitoring detects failing appliances early
- Replace before catastrophic failure (flooding, fire risk)
- Expected prevented damage: $200-500/year
Door/window sensors:
- Alert to doors left open (wasting HVAC energy)
- Prevent break-ins through monitoring
- Value: $100-300/year in prevented losses
Total early detection value: $350-900/year 5-year: $1,750-4,500
Lifestyle Cost Reductions
Smart Home Enabling Behavior Changes:
Remote home management reduces travel:
- Checking on home remotely: Avoids unnecessary trips back home
- Letting service people in remotely: Saves 1-3 trips/year × 30 minutes × $25/hour = $12-37/year
- Minimal but real value: $25-100/year
Reduced food waste:
- Smart refrigerators with cameras: See contents remotely
- Prevents duplicate purchases: $100-300/year savings
- 5-year: $500-1,500
Energy consciousness:
- Real-time energy feedback changes behavior
- Beyond automation, people manually reduce usage
- Additional savings: $50-150/year
- 5-year: $250-750
Elderly/Disability Independence
For Households with Accessibility Needs:
Voice control and automation:
- Reduces need for paid assistance: $500-2,000/month saved
- Or enables aging in place vs assisted living: $3,000-6,000/month saved
- Massive value for those with mobility limitations
For applicable households:
- $6,000-72,000/year in avoided assistance costs
- Transformational financial impact for seniors/disabled
Note: Only applicable to subset of households but extremely valuable when relevant.
Pet Care Cost Reductions
Smart Home Pet Features:
Smart feeders:
- Enables leaving pets home alone longer
- Reduces pet sitting costs: $30-50 per day × 10 days/year = $300-500/year
- 5-year: $1,500-2,500
Pet cameras:
- Monitoring reduces anxiety-driven vet visits
- Catch problems early preventing emergency vet: $500-1,500 prevented every few years
- Expected value: $100-300/year
Smart pet doors:
- Prevents expensive HVAC losses from manual pet doors
- Savings: $100-200/year
- 5-year: $500-1,000
Total pet-related savings (for pet owners): $900-1,000/year 5-year: $4,500-5,000
Rental Income Opportunities
Smart Home Vacation Rental Premium:
For those renting property (Airbnb, VRBO):
- Smart lock enables keyless check-in: Saves $50-100/booking in key management
- Security cameras ensure property protection: Reduces damage by $500-1,000/year
- Smart thermostats optimize heating/cooling between guests: Saves $300-600/year
- Whole-home audio/entertainment increases rental appeal: +$10-30/night premium
Total rental property benefits: $1,000-3,000/year 5-year: $5,000-15,000
Note: Only applicable to those renting out properties, but substantial benefit for that group.
Unexpected Savings Summary
Selective Smart Home Surprising 5-Year Savings:
- Insurance discounts (net after monitoring): -$200 to +$550
- Prevented water damage (expected value): $850
- Energy monitoring insights: $750-1,200
- HVAC lifespan extension: $50-100
- Avoided service calls: $1,000-2,000
- Property value increase (if selling): $1,000-3,000
- Utility rebates and incentives: $425-675
- Early problem detection: $1,750-4,500
- Total Unexpected Savings: $5,625-13,875
- Average: $9,750
Comprehensive Smart Home Surprising 5-Year Savings:
- Insurance discounts: $700-1,200
- Prevented damage (water + other): $2,000-4,000
- Energy monitoring insights: $1,200-2,000
- Avoided service calls: $2,000-3,000
- Property value increase: $5,000-15,000
- Utility rebates: $500-1,000
- Early detection: $3,000-6,000
- Professional service replacement: $1,200-3,000
- Total Unexpected Savings: $15,600-35,200
- Average: $25,400
Key Insight: These unexpected savings offset 30-50% of smart home costs for selective implementations and potentially 50-70% for comprehensive systems, dramatically improving financial outlook versus cost-only analysis.
Important qualifications:
- Insurance savings require professional monitoring (subscription cost)
- Property value gains only realized when selling
- Time savings highly subjective (excluded from financial totals)
- Many benefits probabilistic (prevented damage) not guaranteed
- Some benefits only apply to specific households (pets, rentals, elderly)
Conservative financial analysis: Count only certain savings (insurance, utility rebates, energy insights) totaling $2,000-4,000 over 5 years for selective smart homes. Treat other benefits as bonuses when they occur rather than guaranteed returns.

7. The Obsolescence Factor: Technology Aging
Unlike traditional home components lasting 20-30 years, smart home technology faces rapid obsolescence as standards evolve, companies discontinue products, and newer technologies make older devices outdated. This section analyzes the financial impact of technological aging.
Historical Obsolescence Examples
Real-World Platform Failures (Past 5 Years):
Nest Secure (2020):
- Google discontinued entire product line
- Left early adopters with orphaned systems
- Investment loss: $500-1,500 per household
- No upgrade path, forced complete replacement
Lowe’s Iris (2019):
- Platform completely shut down
- All devices became non-functional
- 100,000+ customers affected
- Average loss: $800-2,000 per household
Insteon (2022):
- Company bankruptcy
- Cloud services went offline
- Devices still functional locally but limited
- Hub-dependent features lost
- Investment loss: $1,000-5,000 for extensive systems
Wink Hub (2020):
- Free service became $5/month subscription
- Forced payment or devices stopped working
- Customer outcry but company maintained decision
- Added $300 over 5 years or forced migration
SmartThings API changes (2021-2023):
- Multiple API deprecations
- Third-party integrations broke
- Community developers abandoned platform
- Reduced functionality for existing users
Financial Impact Pattern:
- 5-15% of smart home platforms experience significant disruption per decade
- Average user investment loss when platform fails: $1,200-4,000
- Probability-weighted expected loss: $120-600 over 10 years
Protocol and Standard Evolution
Communication Protocol Changes:
Z-Wave:
- Z-Wave (original) → Z-Wave Plus → Z-Wave Plus V2 → Z-Wave Long Range
- Backward compatibility maintained but features limited
- Older devices miss security updates, performance improvements
Zigbee:
- Zigbee 1.0 → Zigbee 3.0 → Matter-over-Zigbee
- Fragmentation between manufacturers
- Compatibility issues between Zigbee versions
WiFi:
- 802.11n → 802.11ac → 802.11ax (WiFi 6) → WiFi 6E → WiFi 7
- Older devices congest networks
- Security vulnerabilities in old WiFi standards
Matter (Thread):
- New standard promising universal compatibility (launched 2022)
- Requires new hardware for many devices
- Obsoletes pre-2022 devices lacking Matter support
Financial Impact:
- Hubs require replacement every 5-7 years: $60-200 each
- Major protocol shifts force device upgrades: $500-2,000 every 8-10 years
- 5-year protocol evolution cost: $300-800
Software and Firmware Support Windows
Typical Support Lifecycles:
Budget devices ($20-50):
- Firmware updates: 1-2 years
- Security patches: 1-3 years
- Total useful life: 2-4 years
Mid-range devices ($50-150):
- Firmware updates: 2-4 years
- Security patches: 3-5 years
- Total useful life: 4-7 years
Premium devices ($150+):
- Firmware updates: 3-6 years
- Security patches: 5-8 years
- Total useful life: 6-10 years
Comparison to traditional devices:
- Mechanical light switch: 25-30 years
- Manual thermostat: 15-20 years
- Traditional locks: 20-30 years
- Smart devices last 20-50% as long
The Security Update Problem
Unpatched Devices Become Vulnerabilities:
After manufacturer ends support:
- Security vulnerabilities discovered but not patched
- Devices become network security risks
- Must be replaced or removed from network
Example timeline:
- Year 1-3: Regular security updates
- Year 4-5: Occasional updates
- Year 6+: No updates, mounting vulnerabilities
- Year 7-8: Security researchers recommend removal
Forced replacement due to security:
- 30% of smart devices need premature replacement for security
- Average: 2 years before mechanical failure
- Additional cost: $200-800 over 10 years for security-driven replacements
Compatibility Breakage
When Ecosystems Evolve:
Smart home hub updates:
- Newer hub versions drop support for older devices
- Example: SmartThings v3 hub dropped some v1 device support
- Forces choosing between upgrade path or frozen system
Voice assistant updates:
- Alexa/Google Assistant drop support for older integrations
- Devices lose voice control compatibility
- Must upgrade devices or lose voice functionality
Smartphone app updates:
- iOS/Android updates break older smart home apps
- Manufacturers may not update apps for old devices
- Device becomes unmanageable from modern phones
Financial impact:
- Compatibility breakage forces premature upgrades: $300-1,200 every 3-5 years
- 5-year expected compatibility cost: $300-800
Feature Envy and Voluntary Obsolescence
Psychological Obsolescence:
New features in newer models:
- Year 1: Your smart lock seems cutting-edge
- Year 3: New locks have fingerprint sensors
- Year 5: New locks have facial recognition
- Your lock still works but feels outdated
Marketing pressure:
- Companies constantly promote new models
- Email campaigns highlighting what you’re “missing”
- Social media showcasing latest features
Average smart home owner behavior:
- 40% upgrade devices before failure
- Driven by feature envy, not necessity
- Premature upgrade spending: $400-1,200 over 5 years
Financially rational approach:
- Use devices until failure or security risk
- Resist feature envy
- Save $400-1,200 by avoiding unnecessary upgrades
The “Good Enough” Technology Plateau
When Is Old Technology Adequate?
Functions that haven’t improved much:
- Smart switches: 2015 models work as well as 2025 models
- Basic smart bulbs: Older generations adequate
- Simple sensors: Contact/motion detection unchanged
Functions with meaningful improvements:
- Cameras: Resolution, night vision dramatically better
- Thermostats: Learning algorithms improved
- Voice assistants: NLP and response quality much better
Strategy: Replace devices where technology genuinely improved, keep “good enough” devices functioning.
Modularity as Obsolescence Protection
Design Approaches:
Proprietary integrated systems:
- All-or-nothing upgrades required
- Example: Control4, Crestron whole-home systems
- Obsolescence forces $5,000-15,000 replacement
- High obsolescence risk
Modular open-standard systems:
- Replace individual devices as needed
- Mix brands and generations
- Gradual upgrade path
- Lower obsolescence risk
Financial implication:
- Modular systems cost 15-25% more initially
- But save 40-60% over 10 years through incremental upgrades
- Modular approach saves $2,000-8,000 long-term
Manufacturer Stability Assessment
Company Longevity Risk:
Startups (high risk):
- 50% failure rate within 5 years
- Example: Revolv, Insteon
- Avoid unless prepared to lose investment
Established tech companies (medium risk):
- May abandon product lines strategically
- Example: Google killing Nest Secure
- Generally safer but not immune
Legacy appliance manufacturers (low risk):
- GE, Honeywell, Bosch entering smart home
- Unlikely to abandon product lines completely
- Most stable choice
Open-source platforms (variable risk):
- Community-maintained (Home Assistant)
- No company to fail but requires technical skill
- Best for tech-savvy users
Expected Obsolescence Costs
Selective Smart Home Obsolescence (5-10 years):
Forced upgrades/replacements:
- Protocol evolution: $500
- Security-driven replacements: $300
- Compatibility breakage: $600
- Platform discontinuation risk (15% chance × $1,500): $225
- Total expected: $1,625 over 10 years
- 5-year pro-rated: $812
Comprehensive Smart Home Obsolescence (5-10 years):
Forced upgrades/replacements:
- Protocol evolution (hub replacement): $1,200
- Security-driven device replacement: $1,500
- Compatibility breakage: $2,000
- Platform discontinuation (20% chance × $5,000): $1,000
- Integrated system obsolescence: $3,000-8,000
- Total expected: $8,700-13,700 over 10 years
- 5-year pro-rated: $4,350-6,850
Obsolescence Mitigation Strategies
Reduce Obsolescence Risk:
- Choose open standards: Matter, Zigbee, Z-Wave (vs proprietary)
- Prefer established companies: Google, Amazon, Samsung over startups
- Buy modular systems: Avoid all-in-one integrated solutions
- Maintain local control: Systems working without cloud where possible
- Regular maintenance: Keep firmware updated while support available
- Plan replacement cycles: Budget $300-700/year for gradual upgrades
Financial impact of good choices:
- Reduce obsolescence costs by 40-60%
- Save $500-4,000 over 10 years
The Obsolescence Reality Check
Key findings:
- Smart home technology ages 3-5x faster than traditional equivalents
- Obsolescence costs $800-6,800 over 5 years depending on implementation
- Platform discontinuation creates catastrophic losses for 5-15% of users
- Security vulnerabilities force premature replacement even when devices function
- Strategic planning reduces but cannot eliminate obsolescence risk
For financial planning:
- Budget 10-15% of initial investment annually for obsolescence/upgrades
- Selective smart home: $300-450/year
- Comprehensive smart home: $2,000-3,000/year
Obsolescence represents significant hidden cost, potentially adding 30-50% to total cost of ownership over 10-year periods. Unlike traditional home components providing decades of service, smart home technology requires ongoing investment merely maintaining functionality as standards evolve and platforms change.
8. Insurance, Security, and Property Value Impact
Beyond direct costs and utility savings, smart homes affect insurance premiums, security effectiveness, and property values when selling. This section quantifies these often-overlooked financial dimensions.
Homeowners Insurance Premium Impacts
Security System Discounts:
Professional monitored security:
- Discount: 15-20% on homeowners insurance
- Average premium: $1,400/year
- Annual savings: $210-280
- 5-year: $1,050-1,400
Requirements for discount:
- Professional monitoring service (not self-monitoring)
- Certificates of installation
- Annual monitoring contract
- Some insurers require specific companies (ADT, Vivint)
Smart smoke/CO detectors:
- Additional discount: 5-10%
- Annual savings: $70-140
- 5-year: $350-700
Water leak detection:
- Newer discount category: 5-10%
- Annual savings: $70-140
- 5-year: $350-700
Combined smart home insurance discount:
- Total potential: 25-35% for comprehensive systems
- Annual savings: $350-490
- 5-year: $1,750-2,450
Regional variation:
- High-risk areas (flood, hurricane zones): Larger discounts (up to 40%)
- Low-risk areas: Smaller discounts (10-20%)
Insurer differences:
- State Farm: 15-20% security discount
- Allstate: Up to 20% for multiple smart features
- USAA: 5-15% smart home discount
- Liberty Mutual: 5-20% depending on features
- Farmers: 10-15% security discount
Important: Verify specific discounts with your insurer; not all offer all discounts.
Insurance Coverage Increases
Higher Premiums for Valuable Equipment:
Comprehensive smart home systems:
- $20,000-40,000 in additional equipment value
- Increases replacement cost coverage needed
- Premium increase: $50-150/year
- 5-year: $250-750
Scheduled equipment riders:
- High-value individual items (premium hubs, professional audio)
- Additional coverage: $25-75/year per $10,000 coverage
- 5-year: $125-375
Net insurance impact:
- Discounts: -$1,750 to -$2,450
- Coverage increases: +$375 to +$1,125
- Net 5-year benefit: -$625 to -$2,075 (savings)
Actual Security Effectiveness
Crime Deterrence:
Studies on security system effectiveness:
- Rutgers University study (2017): Alarm systems reduce burglary risk by 60%
- University of North Carolina study: 83% of burglars avoid homes with security systems
Financial impact of prevented burglary:
- Average burglary loss: $2,800 (FBI 2022 data)
- Probability without security: 2.5% annually (national average)
- Probability with security: 1.0% annually (60% reduction)
- Annual expected savings: $42 (0.015 × $2,800 = $42)
- 5-year expected value: $210
Conservative estimate: Security effectiveness provides $200-500 in expected value over 5 years through crime prevention.
Note: Psychological value of security feeling exceeds financial value for most households.
Smart Home Property Value Impact
When Selling Home:
Real estate agent surveys:
- 58% of agents say smart home features help sell homes faster
- 41% say smart homes command price premiums
- Average premium when applicable: 3-5% for well-integrated systems
Buyer preferences (2024 National Association of Realtors):
- 64% want smart thermostats
- 58% want smart security systems
- 46% want smart lighting
- 38% want smart locks
- 30% want whole-home automation
Value Added by Feature:
Selective Smart Home:
- Smart thermostat: +$500-1,000
- Security system (cameras, doorbell): +$1,000-2,000
- Smart lock: +$200-400
- Smart lighting: +$300-700
- Total perceived value: $2,000-4,100
For $300,000 home:
- Percentage increase: 0.7-1.4%
- Sale price impact: +$2,000-4,200
Comprehensive Smart Home:
- Well-integrated professional system: +$5,000-15,000
- Percentage increase: 1.7-5% of home value
- For $300,000 home: +$5,100-15,000
Caveat - Outdated Systems:
- Poorly implemented or outdated smart systems: -$2,000 to -$5,000
- Buyers perceive as removal/upgrade cost
- Proprietary discontinued systems worst
Market Segment Differences
Luxury Market ($500,000+):
- Smart homes expected, not premium
- Absence of smart features: Negative impact (-1-2%)
- Cutting-edge systems: Small premium (+2-3%)
Mid-Market ($200,000-500,000):
- Smart features provide competitive advantage
- Well-done systems: +1-3% premium
- Biggest ROI potential for smart investment
Entry-Level Market (under $200,000):
- Smart features less valued by buyers
- Minimal premium (+0.5-1%)
- Poor ROI for expensive smart implementations
Rental Property Impacts
For Investment Properties:
Smart features in rentals:
- Self-showing with smart locks: Reduce vacancy time by 10-20%
- Security cameras: Reduce property damage claims
- Smart thermostats: Lower utility costs (landlord-paid utilities)
- Attract higher-quality tenants: Reduce turnover
Rental premium:
- Smart-enabled rentals: +$50-150/month premium
- Annual: +$600-1,800
- 5-year: +$3,000-9,000
Reduced vacancy:
- Average vacancy: 8% annually
- Smart showing features reduce to 6%
- For $1,500/month rent: Save $360/year
- 5-year: $1,800
Total rental property benefit: $4,800-10,800 over 5 years
Geographic Variation
Tech-Forward Markets:
- San Francisco, Seattle, Austin, Boston
- Smart homes highly valued: +3-5% premiums common
- Buyer expectation, not optional
Traditional Markets:
- Midwest, rural areas, smaller cities
- Smart homes marginally valued: +0.5-2% premiums
- Some buyers prefer traditional
Climate-Specific Value:
- Hot climates: Smart thermostats highly valued
- Cold climates: Smart heating controls valued
- Coastal areas: Leak detection especially valued (water damage risk)
Appraisal Recognition
Formal Appraisal Challenges:
Problem: Appraisers inconsistently value smart home features
- No standardized valuation methodology
- Comparable sales often lack smart features
- Temporary technology vs permanent improvements
Result:
- Appraisals may not reflect full smart home value
- Refinancing or home equity loans don’t capture investment
- Buyer perception matters more than appraised value
Recommendation:
- Don’t rely on appraisal recognition for smart home ROI
- Value comes through faster sales and buyer premiums
- Not through increased appraised value for refinancing
Age of System Impact
Technology Age vs Value:
Year 1-2 (New):
- Cutting edge: Maximum value
- +3-5% of home value potential
Year 3-5 (Current):
- Still modern: Good value
- +1-3% of home value
Year 6-8 (Aging):
- Functional but dated: Marginal value
- +0.5-1% of home value
Year 9+ (Outdated):
- Perceived liability: Negative value
- -1-2% of home value (buyers discount for removal/upgrade cost)
Implication: Smart home value depreciates faster than traditional home improvements.
Comparison to Other Home Improvements
ROI at Sale:
Kitchen remodel:
- Cost: $25,000
- Value added: $15,000-20,000
- ROI: 60-80%
Bathroom remodel:
- Cost: $15,000
- Value added: $10,000-12,000
- ROI: 65-80%
Solar panels:
- Cost: $20,000
- Value added: $15,000-20,000
- ROI: 75-100%
Selective smart home:
- Cost: $2,880
- Value added: $2,000-4,200
- ROI: 69-146%
Comprehensive smart home:
- Cost: $37,090
- Value added: $5,000-15,000
- ROI: 13-40%
Analysis: Selective smart homes show reasonable ROI; comprehensive systems unlikely to recoup full investment through property value alone.
The Liquidity Problem
Property value benefits only realized when selling:
- Can’t access increased value without selling
- Average homeownership duration: 13 years
- Smart home investment 5 years old when selling (partially depreciated)
Effective ROI calculation:
- Must discount future sale benefit to present value
- 3% discount rate over 8 years (5-year ownership + 13-year average - 10 years)
- $5,000 future value = $3,950 present value
Reality: Property value benefits less significant than utility savings or insurance discounts that provide immediate cash flow benefits.
Insurance and Value Summary
5-Year Financial Impact:
Selective Smart Home:
- Insurance savings: +$625 to +$2,075
- Crime prevention value: +$210
- Property value (if selling): +$2,000-4,200 (but illiquid)
- Total insurance/value benefit: $2,835-6,485
- Liquid benefits only: $835-2,285
Comprehensive Smart Home:
- Insurance savings: +$1,000 to +$2,000
- Crime prevention value: +$400
- Property value (if selling): +$5,000-15,000 (illiquid)
- Total insurance/value benefit: $6,400-17,400
- Liquid benefits only: $1,400-2,400
Key insights:
- Insurance discounts provide reliable, immediate savings
- Crime prevention offers modest but real expected value
- Property value benefits large but illiquid and age-dependent
- Comprehensive systems unlikely to recoup investment through property value alone
- Selective systems show better ROI through insurance/value combined
Insurance and property value impacts provide $800-2,400 in liquid 5-year benefits for most smart home implementations, with potential additional $2,000-15,000 benefits realized only when selling (and only if system still modern at sale time).
9. Time Costs: The Hidden Currency
Time represents valuable resource rarely quantified in smart home cost analyses, yet setup, maintenance, and troubleshooting consume substantial hours. This section monetizes time investments revealing the complete opportunity cost picture.
Initial Setup and Installation Time
Traditional Home Time Investment:
Basic setup:
- Programming thermostat: 15 minutes
- Setting timer switches: 10 minutes × 3 = 30 minutes
- Total: 45 minutes
Selective Smart Home Time Investment:
Research and planning:
- Product research and comparison: 10-15 hours
- Reading reviews, watching videos: 8-12 hours
- Ecosystem selection (Google vs Amazon vs Apple): 3-5 hours
- Planning installation locations: 2-4 hours
- Research total: 23-36 hours
Installation and setup:
- Smart thermostat installation: 2-3 hours (DIY) or $200-300 professional
- Smart lighting setup (20 bulbs/switches): 8-12 hours
- Physical installation: 4-6 hours
- App configuration: 2-3 hours
- Automation programming: 2-3 hours
- Smart locks installation: 1-2 hours per lock = 1-2 hours
- Video doorbell installation: 2-4 hours (hardwired) or 1 hour (battery)
- Security cameras setup: 1 hour per camera = 3 hours
- Hub and network configuration: 3-5 hours
- Voice assistant training: 2-3 hours
- Installation total: 22-32 hours
Troubleshooting and optimization:
- Connectivity issues: 5-8 hours
- Automation refinement: 4-6 hours
- Family member training: 3-5 hours
- Troubleshooting total: 12-19 hours
Selective Smart Home Total Time: 57-87 hours Valued at $25/hour: $1,425-2,175 Valued at $50/hour: $2,850-4,350
Comprehensive Smart Home Time Investment:
Research and planning:
- Extensive product research: 25-40 hours
- Professional system evaluation: 5-10 hours
- Architect/designer consultation: 3-6 hours
- Research total: 33-56 hours
Installation supervision:
- Even with professional installation, homeowner involvement required
- Design decisions during install: 8-12 hours
- Testing and acceptance: 4-6 hours
- Supervision total: 12-18 hours
Configuration and learning:
- Hub system programming: 15-25 hours (even with pro help)
- Automation scene creation: 10-15 hours
- Integration testing: 8-12 hours
- Family training: 6-10 hours
- Documentation and labeling: 4-6 hours
- Configuration total: 43-68 hours
Troubleshooting and optimization:
- Initial bugs and issues: 15-25 hours
- Optimization and refinement: 10-15 hours
- Troubleshooting total: 25-40 hours
Comprehensive Smart Home Total Time: 113-182 hours Valued at $25/hour: $2,825-4,550 Valued at $50/hour: $5,650-9,100
Ongoing Maintenance Time
Traditional Home Annual Time:
- Thermostat battery replacement: 5 minutes
- Light bulb replacements: 30 minutes
- Annual: ~1 hour
- 5-year: 5 hours ($125-250 opportunity cost)
Selective Smart Home Annual Time:
Monthly tasks:
- App updates and installation: 30 minutes/month = 6 hours/year
- Connectivity troubleshooting: 45 minutes/month = 9 hours/year
- Automation adjustments: 30 minutes/month = 6 hours/year
- Monthly total: 21 hours/year
Periodic tasks:
- Firmware updates: 4 hours/year
- Battery replacements: 3 hours/year
- Device resets and repairing: 4 hours/year
- Network troubleshooting: 3 hours/year
- Periodic total: 14 hours/year
Annual major tasks:
- System optimization: 4 hours/year
- Adding new devices: 3 hours/year
- Dealing with discontinued features: 2 hours/year
- Annual total: 9 hours/year
Selective Smart Home Annual Maintenance: 44 hours/year 5-year: 220 hours ($5,500-11,000 opportunity cost)
Comprehensive Smart Home Annual Time:
Monthly tasks:
- App updates: 1 hour/month = 12 hours/year
- Troubleshooting: 2 hours/month = 24 hours/year
- Automation refinement: 1.5 hours/month = 18 hours/year
- Monthly total: 54 hours/year
Periodic tasks:
- Firmware updates (40+ devices): 8 hours/year
- Battery replacements: 6 hours/year
- Device replacements and setup: 8 hours/year
- Network maintenance: 5 hours/year
- Periodic total: 27 hours/year
Annual major tasks:
- Professional system maintenance supervision: 4 hours/year
- Hub system updates: 6 hours/year
- Integration repairs: 5 hours/year
- Documentation updates: 2 hours/year
- Annual total: 17 hours/year
Comprehensive Smart Home Annual Maintenance: 98 hours/year 5-year: 490 hours ($12,250-24,500 opportunity cost)
Troubleshooting Incidents
Common Time-Consuming Issues:
Network connectivity problems:
- Frequency: 4-6 times per year
- Resolution time: 1-3 hours each
- Annual: 4-18 hours
Device offline/unresponsive:
- Frequency: 8-12 times per year
- Resolution time: 15-45 minutes each
- Annual: 2-9 hours
Automation failures:
- Frequency: 10-15 times per year
- Resolution time: 20-40 minutes each
- Annual: 3-10 hours
Hub/platform issues:
- Frequency: 2-4 times per year
- Resolution time: 2-4 hours each
- Annual: 4-16 hours
Voice assistant problems:
- Frequency: 6-10 times per year
- Resolution time: 10-30 minutes each
- Annual: 1-5 hours
Total Troubleshooting Time: 14-58 hours/year Selective systems: 14-30 hours/year Comprehensive systems: 30-58 hours/year
Learning Curve Time
Becoming Proficient:
First year intensive learning:
- Understanding ecosystems: 10-15 hours
- Learning automation concepts: 8-12 hours
- Mastering individual apps: 15-25 hours
- Community forum participation: 10-20 hours
- Watching tutorials: 8-15 hours
- First-year learning: 51-87 hours
Ongoing learning:
- New features: 5-10 hours/year
- Platform updates: 3-6 hours/year
- New device integration: 4-8 hours/year
- Annual ongoing: 12-24 hours/year
Family Member Time
Teaching Others to Use System:
Initial training:
- Spouse/partner: 3-6 hours
- Children: 2-4 hours each × 2 = 4-8 hours
- Elderly parents visiting: 1-2 hours
- Initial training: 8-16 hours
Ongoing support:
- Answering questions: 20-30 minutes/month = 4-6 hours/year
- Fixing their mistakes: 30-45 minutes/month = 6-9 hours/year
- Annual support: 10-15 hours/year
- 5-year: 50-75 hours ($1,250-3,750)
Time Savings from Automation
Claimed Time Benefits:
Automated lighting:
- Eliminates walking to switches: 2-3 minutes/day
- Annual savings: 12-18 hours
Smart thermostat:
- No manual adjustments: 3-4 minutes/day
- Annual savings: 18-24 hours
Smart locks:
- No fumbling for keys: 30 seconds/day × 3 entries = 1.5 minutes/day
- Annual savings: 9 hours
Voice control:
- Faster than manual control: 5 minutes/day
- Annual savings: 30 hours
Security monitoring:
- Remote checking vs physical checking: 10 minutes/week
- Annual savings: 9 hours
Total Claimed Annual Time Savings: 78-90 hours 5-year: 390-450 hours ($9,750-22,500 value)
Reality check: Time savings highly dependent on:
- Whether automation actually works reliably
- Whether it’s faster than manual (often debatable)
- Whether you value the specific time saved
- Whether saved time is productive or just convenience
Conservative estimate: Actual time savings 40-60% of claimed = 31-54 hours/year
The Time Break-Even Analysis
Selective Smart Home Time Balance:
Time invested:
- Setup: 57-87 hours (one-time)
- Annual maintenance: 44 hours/year × 5 = 220 hours
- Total 5-year investment: 277-307 hours
Time saved:
- Automation savings: 31-54 hours/year × 5 = 155-270 hours
- Net time: -7 to -152 hours (time loss)
Conclusion: Selective smart homes rarely save time over 5 years; convenience and functionality provide value, not time savings.
Comprehensive Smart Home Time Balance:
Time invested:
- Setup: 113-182 hours (one-time)
- Annual maintenance: 98 hours/year × 5 = 490 hours
- Total 5-year investment: 603-672 hours
Time saved:
- Automation savings: 50-70 hours/year × 5 = 250-350 hours
- Net time: -253 to -422 hours (massive time loss)
Conclusion: Comprehensive smart homes consume enormous time despite automation benefits.
Time Value Considerations
Who Values Time Most Highly:
- Working professionals ($50-200/hour opportunity cost)
- Business owners (high opportunity cost)
- Parents with limited free time (scarcity increases value)
Who Values Time Less:
- Retirees with abundant time (low opportunity cost)
- Tech enthusiasts (hobby value, negative cost)
- Students (low current earnings, time abundant)
Financial impact of time varies dramatically:
- $25/hour valuation: Selective smart home costs $6,925-7,675 in time
- $50/hour valuation: Selective smart home costs $13,850-15,350 in time
- Tech hobbyist valuation: Time has negative cost (enjoyment pays you)
The “Hobby vs Tool” Distinction
Smart Home as Hobby:
- Time spent is recreational
- Tinkering provides satisfaction
- Learning and optimization enjoyable
- Time cost = $0 or negative (you’d pay for the hobby)
Smart Home as Tool:
- Time spent is instrumental (means to end)
- Setup and maintenance are chores
- Reliability and simplicity valued over features
- Time cost = Full opportunity cost ($25-50+/hour)
Most households: Mixed reality—initial hobby enthusiasm fades to maintenance burden over time.
Time Cost Summary
Traditional Home 5-Year Time Investment:
- Total: 5-10 hours ($125-500)
Selective Smart Home 5-Year Time Investment:
- Setup: 57-87 hours
- Maintenance: 220 hours
- Family training: 50-75 hours
- Total: 327-382 hours ($8,175-19,100 at $25-50/hour)
- Net after time savings: 172-212 hours cost ($4,300-10,600)
Comprehensive Smart Home 5-Year Time Investment:
- Setup: 113-182 hours
- Maintenance: 490 hours
- Family training: 60-90 hours
- Total: 663-762 hours ($16,575-38,100 at $25-50/hour)
- Net after time savings: 413-512 hours cost ($10,325-25,600)
Key insight: Time costs rival or exceed equipment costs for smart homes when opportunity cost valued at professional rates. Only tech hobbyists and retirees with low opportunity costs avoid substantial time costs.
For financial decision-making: If valuing time at professional rates, time costs add $4,000-26,000 to 5-year smart home total cost of ownership, dramatically affecting ROI calculations.

10. 5-Year Total: The Complete Financial Picture
After examining every cost category—initial investment, utilities, maintenance, hidden costs, insurance impacts, obsolescence, and time—this final section assembles the complete 5-year financial comparison revealing true total cost of ownership.
Complete Cost Breakdown: Traditional Home
Initial Investment:
- Equipment and upgrades: $434
- Installation (DIY): $0
- Initial Total: $434
Annual Utility Costs:
- Electricity, gas, water: $3,012/year
- 5-Year Utilities: $15,060
Annual Maintenance:
- Replacements and repairs: $118-130/year
- 5-Year Maintenance: $590-650
Hidden Costs:
- None significant
- 5-Year Hidden: $0
Time Investment:
- Setup and maintenance: 5-10 hours over 5 years
- Valued at $25/hour: $125-250
- 5-Year Time: $125-250
Insurance:
- Standard homeowners: $1,400/year
- 5-Year Insurance: $7,000
Traditional Home 5-Year Total Cost:
- Equipment/Utilities/Maintenance: $16,084-16,144
- With time valued: $16,209-16,394
- With insurance: $23,209-23,394
Complete Cost Breakdown: Selective Smart Home
Initial Investment:
- Equipment: $2,432
- Professional installation (partial): $450
- Initial Total: $2,882
Annual Utility Costs:
- Baseline utilities: $3,012
- Minus savings: -$250
- Plus device consumption: +$59
- Net annual: $2,821/year
- 5-Year Utilities: $14,105
Annual Maintenance:
- Device replacements: $492-536/year
- 5-Year Maintenance: $2,460-2,680
Hidden Costs:
- Subscriptions (cloud storage): $1,140-2,940
- Internet upgrades (if needed): $0-1,200
- Obsolescence and forced upgrades: $812
- Learning curve mistakes: $300-600
- Incompatibility adapters: $100-250
- 5-Year Hidden: $2,352-5,802
Unexpected Savings:
- Insurance discounts (net): -$200 to +$550
- Prevented damage: $850
- Energy insights: $750-1,200
- Utility rebates: $425-675
- Avoided service calls: $1,000-2,000
- 5-Year Savings: $2,825-5,275
Time Investment:
- Setup: 57-87 hours
- Maintenance: 220 hours
- Training family: 50-75 hours
- Troubleshooting: 70-150 hours
- Total: 397-512 hours
- Minus time saved: -155 to -270 hours
- Net time cost: 127-357 hours
- Valued at $25/hour: $3,175-8,925
- Valued at $50/hour: $6,350-17,850
- For analysis: Using $25/hour = $3,175-8,925
Insurance:
- Homeowners with discounts: $1,190-1,250/year
- 5-Year Insurance: $5,950-6,250
Selective Smart Home 5-Year Total Cost:
Without time valued:
- Initial + Utilities + Maintenance + Hidden - Savings + Insurance
- $2,882 + $14,105 + $2,460-2,680 + $2,352-5,802 - $2,825-5,275 + $5,950-6,250
- Total: $24,924-26,494
With time valued at $25/hour:
- Above + Time cost
- $24,924-26,494 + $3,175-8,925
- Total: $28,099-35,419
Comparison to Traditional:
- Without time: +$1,715-3,100 more expensive over 5 years
- With time: +$4,890-12,025 more expensive
Net 5-year cost difference:
- Selective smart home costs $1,700-12,000 MORE than traditional
- Lower end if: High electricity rates, tech hobbyist (no time cost), maximal insurance discounts
- Higher end if: Time valued professionally, low electricity rates, full subscription costs
Complete Cost Breakdown: Comprehensive Smart Home
Initial Investment:
- Equipment: $28,790
- Professional installation: $8,300
- Initial Total: $37,090
Annual Utility Costs:
- Baseline utilities: $3,012
- Minus savings: -$616
- Plus device consumption: +$178
- Net annual: $2,574/year
- 5-Year Utilities: $12,870
Annual Maintenance:
- Device replacements: $4,544/year
- Professional support: $500/year
- Annual: $5,044/year
- 5-Year Maintenance: $25,220
Hidden Costs:
- Subscriptions: $5,700-7,200
- Internet upgrades: $1,500-2,400
- Security/privacy services: $900-1,200
- Obsolescence: $4,350-6,850
- Unplanned expansions: $2,000-4,000
- Compatibility issues: $300-600
- 5-Year Hidden: $14,750-22,250
Unexpected Savings:
- Insurance discounts: $700-1,200
- Prevented damage: $2,000-4,000
- Energy insights: $1,200-2,000
- Property value (if selling): $5,000-15,000 (illiquid)
- Professional service replacement: $1,200-3,000
- Early detection: $3,000-6,000
- 5-Year Liquid Savings: $8,100-16,200
- Plus illiquid property value: $5,000-15,000
Time Investment:
- Setup: 113-182 hours
- Maintenance: 490 hours
- Training: 60-90 hours
- Troubleshooting: 150-290 hours
- Total: 813-1,052 hours
- Minus time saved: -250 to -350 hours
- Net time cost: 463-802 hours
- Valued at $25/hour: $11,575-20,050
- Valued at $50/hour: $23,150-40,100
- For analysis: Using $25/hour = $11,575-20,050
Insurance:
- Homeowners with discounts: $1,100-1,200/year
- 5-Year Insurance: $5,500-6,000
Comprehensive Smart Home 5-Year Total Cost:
Without time valued:
- Initial + Utilities + Maintenance + Hidden - Savings + Insurance
- $37,090 + $12,870 + $25,220 + $14,750-22,250 - $8,100-16,200 + $5,500-6,000
- Total: $87,330-97,230
With time valued at $25/hour:
- Above + Time cost
- $87,330-97,230 + $11,575-20,050
- Total: $98,905-117,280
With property value benefit (if selling):
- Subtract: -$5,000 to -$15,000
- Total: $82,330-112,280 (with time)
Comparison to Traditional:
- Without time: +$64,121-73,836 more expensive
- With time: +$75,696-93,886 more expensive
- With property value: +$59,021-88,886 more expensive
Net 5-year cost difference:
- Comprehensive smart home costs $59,000-94,000 MORE than traditional
- Even with maximum savings and property value benefits
- Only makes financial sense if: Luxury property where smart home expected, very high electricity rates ($0.30+/kWh), tech hobbyist valuing time negatively
Break-Even Analysis
When Does Smart Home Pay for Itself?
Selective Smart Home:
- Additional cost over traditional: $1,700-12,000 (5 years)
- Annual utility savings: $190-250
- Payback period: 6.8-63 years (varies dramatically by circumstances)
Best case break-even (fast):
- High electricity rates ($0.28/kWh): $350/year savings
- Maximum insurance discounts: $300/year
- Prevented water damage (one incident): $8,000 one-time
- Tech hobbyist (zero time cost)
- Break-even: ~3 years
Worst case break-even (never):
- Low electricity rates ($0.10/kWh): $120/year savings
- Minimal insurance discounts: $50/year
- High time cost ($50/hour valuation): $6,000-9,000/year ongoing
- Never breaks even financially
Comprehensive Smart Home:
- Additional cost over traditional: $59,000-94,000 (5 years)
- Annual utility savings: $438
- Annual insurance savings: $300
- Combined savings: $738/year
- Payback period: 80-127 years (exceeds home ownership duration)
With property value benefit:
- Reduces net cost by $5,000-15,000
- Revised payback: 60-120 years (still impractical)
Financial verdict: Comprehensive smart homes do not pay for themselves through savings alone
Regional Scenario Variations
High-Cost Region (California, $0.28/kWh electricity):
Selective Smart Home:
- Utility savings: $390/year (vs $190 national average)
- 5-year additional cost: $300-9,500
- Break-even: 3-25 years (reasonable for many)
Low-Cost Region (Louisiana, $0.10/kWh electricity):
Selective Smart Home:
- Utility savings: $120/year
- 5-year additional cost: $2,300-12,700
- Break-even: 19-106 years (poor financial choice)
The Financial Verdict
Traditional Home:
- 5-Year Cost: $23,200-23,400
- Pros: Lowest cost, proven reliability, no complexity
- Cons: No automation benefits, no insurance discounts
Selective Smart Home:
- 5-Year Cost: $25,000-35,400
- Additional vs Traditional: $1,700-12,000
- Break-even: 7-60 years (highly variable)
- Pros: Meaningful convenience, moderate savings, manageable complexity
- Cons: Ongoing costs, time investment, uncertain ROI
- Financial recommendation: Only worthwhile if high electricity rates, insurance discounts substantial, or hobby value negates time costs
Comprehensive Smart Home:
- 5-Year Cost: $83,000-112,000
- Additional vs Traditional: $59,000-89,000
- Break-even: 60-120 years (never practical)
- Pros: Maximum convenience, strong security, impressive features
- Cons: Enormous cost with no financial justification through savings
- Financial recommendation: Purely lifestyle purchase for affluent households; cannot be justified financially through utility savings or other monetary benefits
Who Should Choose Each Option?
Traditional Home (Financial Winner):
- Budget-conscious households
- Renters unable to install permanent fixtures
- Tech-averse users
- Those valuing simplicity and reliability
- Anyone prioritizing lowest cost above convenience
Selective Smart Home (Compromise):
- Moderate budgets ($3,000-5,000 available)
- Tech-comfortable users
- High electricity rate regions
- Those valuing security and insurance discounts
- Homeowners planning 5+ year occupancy
- Balance of convenience and cost-consciousness
Comprehensive Smart Home (Lifestyle Choice):
- High net worth households ($1M+ assets)
- Luxury property owners
- Tech enthusiasts for whom smart home is hobby
- Those prioritizing convenience over cost
- Homes where smart home expected for resale
- No expectation of financial return; purely for enjoyment
The Surprising Financial Truth
Key findings:
- Smart homes cost more, not less: Even with utility savings, total cost of ownership exceeds traditional homes by $1,700-89,000 over 5 years
- Utility savings disappointed: Real savings 30-50% below marketing claims after accounting for device consumption, behavior factors, and regional variations
- Hidden costs massive: Subscriptions, obsolescence, time, and maintenance add 50-200% to initial investment costs
- Insurance benefits real but modest: $200-2,000 over 5 years helps but doesn’t change overall financial picture
- Time costs enormous: 300-800 hours over 5 years valued at $4,000-40,000 depending on opportunity cost
- Property value benefits uncertain: Age of system, buyer preferences, and market conditions create high variability; often negative for older systems
- Break-even rarely achieved: Selective systems break even in 7-60 years; comprehensive systems never break even financially
- Lifestyle not financial investment: Smart homes should be chosen for convenience, security, and enjoyment—not financial returns
The bottom line: Smart homes represent lifestyle upgrades providing convenience, security, and modern living at substantial financial cost. They are not money-saving investments but rather expensive conveniences similar to luxury cars or high-end appliances—valuable to those who can afford them and appreciate benefits, but poor financial investments judged purely on ROI.
For financially-motivated buyers: Skip comprehensive systems entirely. Consider selective smart home implementation only in high-electricity-cost regions where utility savings plus insurance discounts create reasonable (though still marginal) returns. Otherwise, traditional approaches deliver best financial outcomes.
For lifestyle-motivated buyers: Choose smart home level matching your budget and enthusiasm, acknowledging you’re paying premium for convenience and technology enjoyment rather than making investment that pays for itself.

Conclusion: Making the Right Financial Decision
The comprehensive 5-year financial analysis comparing smart homes to traditional approaches reveals uncomfortable truths that marketing materials and enthusiastic tech reviews conveniently ignore: smart homes cost substantially more than traditional homes across virtually every financial dimension when honestly accounting for all expenses including initial investment, ongoing maintenance, subscriptions, obsolescence, and time investments. The promise that smart home automation pays for itself through utility savings proves false for most implementations and most households, with selective smart homes requiring 7-60 years to break even financially and comprehensive smart homes never achieving payback within practical home ownership timespans.
The detailed cost breakdowns demonstrate that selective smart home implementations add $1,700-12,000 to 5-year total costs versus traditional approaches, while comprehensive smart home systems add staggering $59,000-94,000 over the same period. These additional costs stem from multiple sources: initial equipment investments of $2,900-37,000 beyond traditional components; ongoing maintenance costs 3-6 times higher than traditional equivalents due to faster replacement cycles and electronic component failures; subscription fees totaling $1,100-7,200 over 5 years for cloud storage and monitoring services rarely mentioned in purchase price marketing; obsolescence and forced upgrades costing $800-6,800 as technology ages and protocols evolve; and time investments of 300-800 hours over 5 years for setup, troubleshooting, and maintenance valued at $4,000-40,000 depending on opportunity cost assessments.
Against these substantial costs, smart homes deliver genuine but modest savings and benefits that partially offset but never fully justify expenses for most households. Utility savings prove real but disappointing, averaging $190-438 annually for selective to comprehensive implementations—substantially below the 25-35% reductions marketing materials promise. These savings depend heavily on regional electricity rates, climate zones, occupancy patterns, and whether households actually utilize automation features to change behavior, with many smart home owners realizing minimal savings by overriding automation or maintaining manual control habits. Insurance premium reductions provide $200-2,000 in 5-year benefits but require professional monitoring subscriptions costing $1,200-2,400 over the same period, creating net benefits only for high-premium households in expensive homes or high-risk areas.
The unexpected savings that smart home advocates cite—prevented water damage, early problem detection, HVAC lifespan extension, and reduced service calls—provide genuine value totaling $2,800-16,000 over 5 years in expected value terms. However, these benefits prove probabilistic rather than guaranteed, vary dramatically between households, and often require comprehensive rather than selective implementations to fully realize. Property value impacts show high variability and uncertainty, with well-implemented modern systems potentially adding $2,000-15,000 to home values when selling but outdated or poorly integrated systems creating negative value as buyers perceive them as removal or upgrade burdens requiring discounts of $2,000 - 5,000.
The obsolescence factor represents perhaps the most significant and least discussed financial risk in smart home investments. Unlike traditional mechanical switches and thermostats lasting 20-30 years with minimal maintenance, smart home devices face 3-8 year replacement cycles driven by electronic component failures, software support termination, protocol evolution, and platform discontinuations. Real-world examples from the past five years including Nest Secure discontinuation, Lowe’s Iris platform shutdown, Insteon bankruptcy, and Wink’s forced subscription model demonstrate that 5-15% of smart home platforms experience significant disruptions per decade, creating $1,200-8,000 losses when systems become orphaned or unsupported. This obsolescence risk adds expected costs of $800-6,800 over 10 years that traditional approaches completely avoid.
The time investment dimension proves particularly significant yet rarely quantified in smart home financial analyses. Selective smart home implementations require 300-500 hours over 5 years for research, installation, configuration, troubleshooting, optimization, and family member training, while comprehensive systems demand 600-800 hours over the same period. Even accounting for automation time savings of 150-350 hours over 5 years, smart homes create net time costs of 150-500 hours valued at $4,000-25,000 depending on whether opportunity cost is assessed at modest $25/hour or professional $50/hour rates. Only tech hobbyists for whom smart home tinkering represents enjoyable recreation rather than instrumental burden avoid these time costs, while working professionals and busy parents face substantial opportunity costs that dramatically worsen smart home financial equations.
Regional factors significantly affect financial outcomes, with high electricity rate regions ($0.22-0.32/kWh in California, Hawaii, and Northeast states) experiencing utility savings 40-75% higher than national averages, improving selective smart home payback periods from 20-60 years to 7-15 years. Cooling-dominated climates in southern and southwestern states see stronger smart thermostat benefits than moderate climate regions, while heating-dominated northern climates experience good but not exceptional HVAC savings. Low electricity rate regions ($0.08-0.12/kWh in Louisiana, Washington, and other areas) see utility savings insufficient to justify smart home investments on financial grounds, with payback periods extending to 40-100+ years making smart home adoption purely lifestyle rather than financially-motivated decision.
The analysis reveals that selective smart home approaches focusing on high-value automation—smart thermostats, selective lighting in key areas, basic security with video doorbell and cameras, and smart locks—provide the best balance of convenience versus cost for households interested in smart home benefits without comprehensive implementation expenses. These moderate systems costing $2,900-5,000 initially with $900-1,600 annual ongoing costs deliver 70-80% of comprehensive smart home functionality at 15-20% of the cost, creating more manageable financial commitments with better (though still marginal) returns on investment. The selective approach also reduces obsolescence risk by limiting the number of devices requiring replacement when standards evolve and provides easier migration paths when upgrading or changing ecosystems.
Comprehensive smart home implementations spanning whole-home lighting control, advanced HVAC with zoning, extensive security systems, motorized window coverings, smart appliances, and professional integration systems costing $37,000-50,000 initially with $5,700-7,300 annual ongoing expenses cannot be financially justified through any combination of utility savings, insurance discounts, or property value appreciation. These extensive systems serve as luxury lifestyle purchases comparable to high-end kitchen renovations, custom home theaters, or luxury vehicle purchases—valuable and enjoyable to those who can afford them and appreciate the convenience and modern living benefits, but poor investments when evaluated purely on financial returns or cost recovery potential.
The surprising finding that traditional homes deliver best financial outcomes for budget-conscious households challenges conventional wisdom that smart home technology inevitably represents progress and improvement. Traditional approaches costing just $400-650 to implement beyond standard home components with minimal annual maintenance ($120-130/year) and negligible time investments provide reliable, simple, proven functionality for lighting, climate control, and security at total 5-year costs of $16,000-23,000 including utilities and insurance. While lacking automation convenience and modern features, traditional approaches avoid subscription traps, obsolescence risks, troubleshooting frustrations, and time burdens that accompany smart home ownership.
For different household types, optimal decisions vary based on financial resources, technical comfort, lifestyle priorities, and regional factors. Budget-conscious households, renters unable to install permanent fixtures, tech-averse users valuing simplicity, and anyone prioritizing lowest costs should default to traditional approaches with potentially selective addition of smart thermostats in high-electricity-cost regions where payback period drops to 2-4 years making them worthwhile investments even for cost-focused buyers. Moderate-income homeowners comfortable with technology and willing to allocate $3,000-5,000 for convenience can reasonably implement selective smart home systems accepting marginal or neutral financial outcomes justified by convenience and security benefits. High net worth households ($1 million+ assets) for whom $37,000-50,000 represents manageable discretionary spending can pursue comprehensive automation as lifestyle enhancement without financial justification required, similar to other luxury home improvements undertaken for enjoyment rather than return on investment.
The critical insight for prospective smart home buyers lies in understanding that smart home decisions represent lifestyle choices rather than financial investments, with convenience, security, accessibility, and technology enjoyment as primary benefits while financial returns prove elusive or negative for most implementations. Marketing claims that smart homes “pay for themselves” through energy savings prove fundamentally false when honestly accounting for total cost of ownership including hidden costs, ongoing expenses, obsolescence, and time investments. Instead, smart home technology resembles luxury appliances or premium building materials—they enhance living experience and provide genuine benefits to those who value them, but they cost more rather than less than basic alternatives with savings insufficient to justify investments on purely financial grounds.
For financially-motivated buyers, the recommendation involves skepticism toward comprehensive smart home systems and careful evaluation of selective implementations, proceeding only when high electricity rates, substantial insurance discounts, or specific high-value features (security monitoring, water leak detection) create plausible paths to modest positive or neutral financial outcomes. Even then, acknowledging that break-even occurs over 7-15 year horizons while facing obsolescence risks suggests treating smart home investments as lifestyle expenditures providing convenience worth their cost rather than as financially-motivated efficiency improvements expected to reduce overall spending.
For lifestyle-motivated buyers who value convenience, modern living, technology integration, and automation benefits regardless of financial returns, smart home implementations from selective to comprehensive become defensible personal choices made with clear understanding of financial implications. The analysis provides detailed cost breakdowns enabling realistic budgeting for both initial investments and ongoing expenses including subscriptions, maintenance, and time commitments, preventing the unpleasant surprises that frequently discourage smart home adopters who entered implementations expecting modest initial costs followed by utility savings rather than discovering substantial ongoing expenses and time burdens.
The broader lesson extends beyond smart home technology specifically to consumer technology decisions generally: marketing hype emphasizing potential savings or efficiency gains should face skeptical analysis accounting for total cost of ownership including hidden expenses, replacement cycles, time investments, and realistic rather than theoretical benefits. The gap between marketing promises and financial reality proves particularly wide for smart home products where companies profit from ongoing subscriptions and device replacement cycles, creating business model incentives to minimize or hide true ownership costs while emphasizing attractive initial purchase prices and optimistic energy savings projections.
Looking forward, smart home technology continues evolving with new standards like Matter promising improved compatibility, declining device costs through competition and manufacturing scale, and improving reliability as technologies mature. However, fundamental economics likely persist: electronic devices require more frequent replacement than mechanical alternatives, software and connectivity introduce ongoing maintenance and subscription costs absent from traditional approaches, and time investments for setup and troubleshooting remain substantial regardless of improving user interfaces. These structural factors suggest that smart homes will remain more expensive than traditional approaches even as specific costs decline, making them lifestyle choices rather than financially-justified investments for foreseeable future.
Your specific decision depends on personal circumstances including budget constraints, technical comfort level, home ownership versus renting status, climate affecting utility costs, occupancy patterns affecting automation value, household size influencing capacity needs, and subjective valuation of convenience versus cost savings. Use the detailed cost breakdowns provided throughout this analysis to calculate expected costs and benefits for your situation, applying regional electricity rates, personal time valuations, and household-specific factors to determine whether selective smart home implementation makes sense financially or whether traditional approaches or lifestyle-motivated comprehensive systems better match your priorities and resources.
The question posed initially—which actually saves money, smart homes or traditional homes?—has clear answer: traditional homes cost substantially less across all financial dimensions, with smart homes adding $1,700-94,000 in 5-year expenses depending on implementation level. Smart homes provide genuine convenience, security, and lifestyle benefits that justify costs for many households, but they do not save money compared to traditional approaches when honestly accounting for complete ownership costs. Make smart home decisions based on lifestyle benefits you value and can afford, not on financial savings promises that analysis reveals as illusory for most implementations and most households.
Frequently Asked Questions
Q: Will a smart thermostat really pay for itself through energy savings?
Smart thermostats save genuine but modest amounts on utility bills, averaging 8-15% on HVAC costs when used effectively. For typical household with $800/year HVAC electricity costs, this translates to $64-120 annual savings. A $250 smart thermostat thus requires 2-4 years to pay for itself through direct energy savings alone. However, several factors affect payback: occupancy patterns matter enormously—households away regularly during work hours see stronger savings than those home frequently; existing thermostat baseline affects results—upgrading from manual thermostat saves more than upgrading from already-programmable thermostat; climate zone influences savings—extreme hot or cold climates with high HVAC usage see faster payback than moderate climates; electricity rates scale savings proportionally—$0.28/kWh California rates double payback speed versus $0.14/kWh rates; and user behavior determines whether automation actually changes temperature settings versus being overridden manually. In high-electricity-cost regions with cooling-dominated climates and households away during day, smart thermostats pay for themselves in 18-30 months. In moderate climates with low electricity rates and frequent occupancy, payback extends to 4-8 years. The financial case strengthens when considering insurance discounts (some insurers offer 5% premium reduction), HVAC lifespan extension through optimized cycling, and convenience value of remote control and automated schedules.
Q: Do smart homes actually increase property value when selling, and by how much?
Smart home property value impacts vary dramatically based on system age, integration quality, and buyer preferences, making this perhaps most uncertain financial benefit. Well-implemented modern smart home systems (less than 3 years old) with mainstream platforms (Google, Amazon, Apple) add modest value, with selective systems adding $2,000-4,000 and comprehensive professional systems adding $5,000-15,000 to sale prices. Real estate agent surveys indicate 58% report smart homes help sell faster while 41% report price premiums averaging 1-3% for mid-market homes ($200,000-500,000). However, outdated systems (5+ years old), proprietary discontinued platforms, or poorly integrated DIY implementations create negative value, with buyers demanding $2,000-5,000 discounts to cover removal or upgrade costs. Property value benefits only realize when actually selling, making them illiquid for owners planning extended occupancy. Market segment matters significantly—luxury homes ($500,000+) where smart features expected see minimal premium for presence but penalties for absence, while entry-level homes (under $200,000) show negligible buyer willingness to pay premiums for automation. Geographic variation proves substantial, with tech-forward markets (San Francisco, Seattle, Austin) valuing smart homes highly while traditional markets (Midwest, rural areas) show buyer indifference or skepticism. The recommendation: don’t implement smart home systems primarily for resale value given uncertainty and age-related depreciation; if installing for personal use, choose mainstream platforms and professional integration to maximize value retention if eventually selling.
Q: Are subscription fees for smart home devices really necessary, or can I avoid them?
Subscription requirements vary dramatically by device type and manufacturer, with some genuinely requiring subscriptions for basic functionality while others offer full features without recurring fees. Security cameras prove most subscription-dependent, with popular brands like Ring, Nest, and Arlo requiring $3-10/month per camera for video history beyond 24-48 hours, creating $180-600 annual costs for multi-camera systems. However, alternatives exist including Wyze ($2/month optional), Eufy (free local storage), and UniFi (self-hosted recording), enabling complete avoidance of cloud storage subscriptions through local storage or self-hosting options. Video doorbells follow similar patterns with Ring ($4/month), Nest ($6/month) requiring subscriptions while Eufy and others offer free local storage. Professional security monitoring subscriptions ($20-40/month) remain optional for most systems, with self-monitoring via smartphone apps providing basic functionality free though without benefits of professional dispatch. Smart thermostats, lighting, locks, and most other device categories function fully without subscriptions, making subscriptions avoidable through careful product selection. Voice assistants (Alexa, Google Assistant) provide core features free with optional premium subscriptions ($10/month) adding music streaming or advanced features most users skip. The strategy for minimizing subscriptions involves choosing brands explicitly offering local storage options; using network-attached storage (NAS) devices for self-hosted recording; accepting shorter video history windows (24-48 hours vs 30-60 days) available free; and skipping professional monitoring unless specifically desired for insurance discounts or peace of mind. With strategic selection, smart home systems can operate with zero subscriptions, though convenience and features often suffer compared to cloud-based competitors, creating trade-off between ongoing costs and optimal functionality that each household must evaluate based on priorities.
Q: How often do smart home devices actually fail and need replacement compared to traditional alternatives?
Smart home devices exhibit dramatically shorter lifespans than traditional mechanical equivalents due to electronic component failures, software obsolescence, and battery degradation. Smart bulbs last 3-5 years average compared to 10+ years for traditional LEDs; smart switches endure 5-8 years versus 20-30 years for manual switches; smart locks survive 5-7 years versus 20-25 years for mechanical locks; smart cameras last 3-5 years versus decades for traditional security systems; smart thermostats function 8-10 years versus 15-20 years for traditional programmable thermostats; voice assistant hubs last 4-7 years before replacement; and sensors (leak, motion, contact) operate 3-6 years before battery or electronic failures. The accelerated replacement cycle stems from multiple factors: non-replaceable integrated batteries degrading within 3-5 years; electronic components (capacitors, circuits) failing more frequently than mechanical switches; software and firmware support terminating after 3-5 years leaving devices vulnerable or non-functional; protocol and connectivity standard evolution making older devices incompatible with newer systems; and non-serviceable integrated designs preventing repairs forcing complete replacement. Financial implications prove substantial—selective smart home systems require $500-700 annually in replacement devices compared to $120-150 for traditional equivalents, while comprehensive systems demand $2,000-3,000 annually. Manufacturers design non-repairable products maximizing replacement revenue rather than longevity, creating planned obsolescence common across consumer electronics but particularly problematic for home infrastructure expected to function decades. Mitigation strategies include buying higher-quality premium devices with longer support commitments; choosing platforms with open standards enabling migration between manufacturers; maintaining local control backups when cloud services fail; budgeting 10-15% of initial investment annually for replacements; and accepting that smart home technology requires ongoing investment unlike traditional approaches providing decades of maintenance-free service.
Q: Is it worth getting a smart home if I’m renting an apartment?
Smart home adoption for renters requires different approach than homeowners due to installation limitations and portability requirements. Renters should focus exclusively on portable, non-permanent smart devices avoiding hardwired installations that risk security deposits or require removal when moving. Recommended renter-friendly devices include battery-powered smart locks replacing existing locks temporarily with originals stored safely; wireless security cameras and video doorbells using adhesive mounts or free-standing options; plug-in smart lighting using smart bulbs in existing fixtures or smart plugs controlling lamps; portable smart thermostats like Sensibo or Cielo attaching to existing thermostats without replacement; and battery-powered sensors (leak, motion, contact) using adhesive mounting. Avoid hardwired switches requiring electrical work; wired video doorbells requiring doorbell replacement; smart vents or permanent HVAC modifications; motorized window treatments requiring installation; and any modifications requiring wall damage or permanent fixture changes. Financial considerations for renters differ substantially from homeowners: inability to recoup investments through property value requires faster payback through utility savings alone; moving costs add $400-700 in time and materials per relocation to uninstall and reinstall portable systems; shorter average occupancy (2-4 years vs 13 years for owners) reduces time for realizing savings; landlord-controlled utilities (common in apartments) eliminate direct financial benefit from energy savings; and limited implementation scope reduces total benefits relative to costs. The financial analysis for renters shows selective smart home systems ($1,200-2,000 in portable devices) break even only in high-electricity regions where occupancy exceeds 4 years and tenant pays utilities directly—marginal proposition for most renters. Better approach involves focusing on highest-value devices only: smart thermostat if controlling heating/cooling costs ($250 with 18-36 month payback); smart lock for keyless convenience avoiding lockout emergencies ($150-230); and minimal security (video doorbell, 1-2 cameras) for safety rather than financial returns ($250-400). Total portable system cost $650-880 provides core smart home benefits without excessive expense risking loss when moving or financial returns proving insufficient given rental constraints.
Q: What happens if the smart home company goes out of business or discontinues my devices?
Platform discontinuation represents significant risk rarely discussed honestly by smart home companies, with multiple high-profile examples from past five years demonstrating financial impact: Nest Secure (2020) discontinuation by Google left early adopters with $500-1,500 in orphaned security equipment; Lowe’s Iris (2019) platform shutdown bricked all devices for 100,000+ customers averaging $800-2,000 losses per household; Insteon (2022) bankruptcy took cloud services offline limiting device functionality; and Revolv (2016) hub termination by Nest rendered all connected devices non-functional. When platforms fail, consequences include immediate or gradual loss of functionality as cloud services terminate; inability to add new devices or make changes without cloud connectivity; security vulnerabilities as firmware updates cease; loss of integrations with other platforms when APIs shutdown; and orphaned investment requiring complete system replacement from scratch. Financial protection strategies include choosing established companies over startups—Google, Amazon, Apple, Samsung less likely to exit smart home despite possibility versus startups with 50% failure rate within 5 years; prioritizing devices with local control capabilities functioning without cloud services when network or company fails; selecting open standard protocols (Matter, Zigbee, Z-Wave) enabling device migration between platforms rather than proprietary systems locking you to single manufacturer; maintaining hybrid systems mixing brands preventing total loss if one manufacturer fails; avoiding all-or-nothing integrated professional systems where single platform failure destroys entire investment; and budgeting replacement reserves acknowledging 5-15% probability of partial platform failure over 10 years creating expected losses of $120-600 (0.10 probability × $1,200-6,000 average loss). Risk assessment by platform: highest risk includes startups and companies showing financial distress; medium risk encompasses Google (history of product discontinuation), Samsung, and smaller established companies; lower risk applies to Amazon, Apple with smart home as strategic priority rather than experimental product line; and lowest risk involves open source community-maintained platforms like Home Assistant though requiring technical expertise. The uncomfortable reality requires acknowledging that smart home products lack the longevity guarantees of traditional home infrastructure, with 10-20 year useful life expectations reasonable for traditional switches but only 5-8 years for smart equivalents before obsolescence through discontinuation or abandonment creates forced replacement independent of device functionality.
Q: Can I install smart home devices myself, or do I need professional installation?
DIY versus professional installation depends on device types, technical skills, local electrical codes, and cost-benefit calculations varying by household. Most smart home devices support DIY installation with varying difficulty levels: smart bulbs and smart plugs require zero installation beyond screwing in bulbs or plugging in devices (easiest, anyone can do); battery-powered devices (cameras, sensors, locks) need basic tool skills for mounting and configuration (easy, 1-2 hours each); wired thermostats require electrical connection understanding but usually manageable with online tutorials and basic tools (moderate, 2-4 hours with care); hardwired switches and dimmers demand electrical work knowledge and code compliance for safety (moderate-difficult, professional recommended unless experienced); and wired security systems, integrated hubs, and whole-home automation require professional installation for most users (difficult, $200-8,300 depending on scope). DIY advantages include significant cost savings ($450-8,300 avoided labor); learning system intimately for troubleshooting; installation on your schedule without coordinating professionals; and avoiding contractor markups on equipment by purchasing directly. DIY disadvantages encompass time investment (40-120 hours for complete systems); learning curve frustration; mistakes risking device damage, electrical hazards, or code violations; warranty concerns if manufacturer requires professional installation; and lack of integrated system design and programming expertise for complex implementations. Professional installation makes sense when electrical work exceeds comfort level (safety critical); implementing comprehensive systems where integration and programming justify expertise; local codes require licensed electricians for hardwired devices; time cost exceeds money cost (busy professionals valuing time highly); or warranty requirements mandate professional installation for coverage. Cost-benefit calculations show DIY saves $1,800-8,000 on selective to comprehensive systems but consumes 50-150 hours valued at $1,250-7,500 at $25/hour rates—net savings of $550-6,750 after time costs. For working professionals valuing time at $50/hour, DIY time costs ($2,500-7,500) approach professional installation costs making professional installation economically sensible. Hybrid approaches prove optimal for many households: DIY simple devices (bulbs, plugs, sensors, cameras) while hiring electricians for hardwired switches and thermostats, saving money on easy installations while ensuring safety and code compliance for complex electrical work. Most smart home manufacturers design systems for DIY installation with detailed instructions, video tutorials, and phone support making successful installation achievable for moderately handy individuals willing to invest learning time.
Q: Do smart homes actually save time, or do they end up taking more time to manage?
Time analysis reveals surprising conclusion: smart homes consume substantially more time than they save for most implementations and most users, contradicting marketing promises of time-saving automation. Setup time demands 60-180 hours for selective to comprehensive systems including research, installation, configuration, troubleshooting, optimization, and family training—one-time investment but substantial. Ongoing maintenance requires 40-100 hours annually for troubleshooting connectivity issues, applying updates, managing batteries, fixing automation failures, and dealing with device offline events—this continues indefinitely unlike one-time setup. Time saved through automation proves smaller than expected at 30-70 hours annually from eliminated switch flipping, thermostat adjusting, and manual checks, with actual savings varying enormously based on whether automation works reliably and whether saved seconds actually create productive time versus minor conveniences. Net time calculation over 5 years shows selective smart homes consume 150-350 net hours (420 total minus 155-270 saved) while comprehensive systems consume 450-650 net hours (850-1050 total minus 250-400 saved)—smart homes take more time, not less, for most users throughout ownership. Time savings materialize primarily for specific user profiles: tech hobbyists who enjoy tinkering value setup and maintenance time as recreation with negative cost (they’d pay for the hobby); busy professionals benefit most from automation eliminating trips home to check on issues, let in service people, or adjust climate—time savings worth more than maintenance time costs; accessibility users with mobility limitations realize transformational time savings through voice control and automation reducing need for physical movement around home; and vacation rental operators save substantial time through keyless check-in, remote monitoring, and automated turnover management. Time costs prove minimal or negative for these groups making smart home time economics favorable. However, average households, retirees with abundant time, and those seeking “set it and forget it” reliability experience net time losses ranging from $4,000-25,000 over 5 years when valuing time at $25-50/hour rates. The critical insight: view smart homes as hobbies or tools depending on personality—tech enthusiasts treating smart homes as engaging hobbies experience time spending as recreation while those viewing smart homes purely as tools find time requirements burdensome. Marketing claims of “saving time” prove accurate only for specific automation benefits (remote management, voice control for disabled users, rental property management) while ignoring substantial time costs of setup, maintenance, and troubleshooting that exceed savings for typical users. Realistic expectations involve accepting smart homes as convenience upgrades requiring time investments rather than as time-saving automation reducing overall life management burden.
Q: Are smart homes secure from hackers, and what are the real security risks?
Smart home cybersecurity presents genuine risks requiring acknowledgment and mitigation rather than dismissal or panic. Real security threats include unauthorized access to cameras and microphones enabling surveillance; smart lock hacking allowing physical home access; thermostat and appliance manipulation causing inconvenience or damage; network infiltration using poorly secured IoT devices as entry points; data theft accessing personal information, schedules, and habits; and botnet recruitment incorporating smart devices into DDOS attack networks. Probability assessment shows most households face low individual risk (1-3% experiencing breaches) but massive potential consequences when breaches occur including privacy invasion, physical security threats, identity theft cleanup costing $500-5,000, and time dealing with breach aftermath (30-100 hours). Security best practices substantially reduce risk: use strong unique passwords for every device and service avoiding reuse across platforms; enable two-factor authentication wherever available adding critical second security layer; maintain updated firmware and software applying security patches promptly when manufacturers release them; segment smart home devices onto separate network from computers and phones preventing lateral movement if device compromised; disable unused features like remote access when not actively needed reducing attack surface; research device security before purchase avoiding brands with poor security track records; consider VPN services ($5-10/month) protecting smart home traffic from interception; and monitor network traffic for unexpected connections indicating compromised devices. Manufacturer security quality varies dramatically with consumer-grade brands showing mixed security practices while security-focused companies prioritize protection: highest risk includes cheap unbranded devices from unknown manufacturers often containing backdoors or minimal security; medium risk encompasses major consumer brands (Ring, Nest, Wyze) with adequate but not exceptional security; and lower risk applies to enterprise-grade equipment (Ubiquiti, Control4) with professional security focus though higher costs. The Ring camera hacking incidents (2019-2020) where attackers accessed cameras due to credential stuffing and lack of 2FA demonstrate real risks but also show that breaches predominantly target users failing security basics rather than indicating inherent unfixable vulnerabilities. Security advice involves treating smart home security as ongoing practice rather than one-time setup through regular password updates, prompt firmware application, periodic security audits checking device configurations, and maintaining awareness of disclosed vulnerabilities affecting owned devices. For high-security-concern households: minimize devices with cameras and microphones; prioritize local storage and processing over cloud services; consider professional-grade equipment with security certifications; and potentially skip smart home adoption entirely if risk tolerance extremely low. For average households: implement basic security practices (strong passwords, 2FA, updates) reducing risk to acceptable levels while maintaining convenience benefits; understand that perfect security proves impossible but reasonable protections make successful attacks unlikely; and balance security concerns against benefits rather than abandoning smart home technology entirely based on theoretical risks rarely realized by typical users following security basics.
Q: What’s the smartest way to start with smart home tech without spending a fortune?
Strategic smart home adoption focusing on highest-value devices first while avoiding expensive mistakes enables experiencing benefits at reasonable cost. Start with smart thermostat ($180-320) as single highest-ROI device providing 8-15% HVAC savings with 2-4 year payback—choose Ecobee or Nest for reliability and features. Add selective smart lighting (5-10 bulbs, $150-350) in highest-use areas (living room, kitchen, bedroom) providing automation benefits without whole-home expense—choose WiFi bulbs (Wyze, LIFX) avoiding hub requirement initially or Philips Hue if planning expansion. Include smart plug strips ($15-40) for entertainment centers and home office controlling multiple devices simultaneously while monitoring phantom power consumption. Optional additions based on priorities include: video doorbell ($120-250) if security or package monitoring valued; smart lock ($150-280) if keyless entry appeals; or voice assistant ($50-100) enabling voice control if already using smartphone assistants. This strategic starter system totals $500-1,100 providing core automation without excessive investment. Avoid common beginner mistakes: don’t buy comprehensive systems immediately before understanding actual usage preferences; skip cheap off-brand devices that frustrate and fail quickly despite lower initial cost; avoid proprietary ecosystem lock-in by choosing WiFi devices or matter-compatible options enabling future flexibility; don’t subscribe to optional services initially until determining whether free tiers suffice; resist temptation to automate everything—start small and expand based on what actually provides value; and refuse marketing pressure for whole-home systems requiring $5,000-10,000 before determining whether smart home features match your lifestyle. Phased expansion strategy works best: Year 1 core system ($500-1,100) focused on thermostat, selective lighting, smart plugs; Year 2 security additions ($300-600) adding cameras and doorbell if desired after experiencing smart home benefits; Year 3 convenience expansion ($200-500) including additional lighting, sensors, or appliances based on proven value from initial phases; and ongoing gradual additions replacing failed devices or adding new capabilities as wants develop. This approach limits initial financial exposure while providing core benefits, enables learning ecosystem preferences before deep commitment, and avoids expensive mistakes requiring replacement of poorly-chosen initial systems. Budget allocation should prioritize devices directly saving money (smart thermostat) over pure convenience devices, focus spending on frequent-use areas providing daily benefits rather than rarely-used spaces, and emphasize reliability over cutting-edge features—year-old proven devices often provide better value than newest releases with premium pricing and uncertain reliability. The financially smart start involves $500-1,100 strategic initial investment in proven high-value devices with phased expansion based on demonstrated value and stable budget, avoiding the $3,000-5,000 comprehensive implementation many beginners attempt before understanding actual usage patterns and preferences.
Articles related:


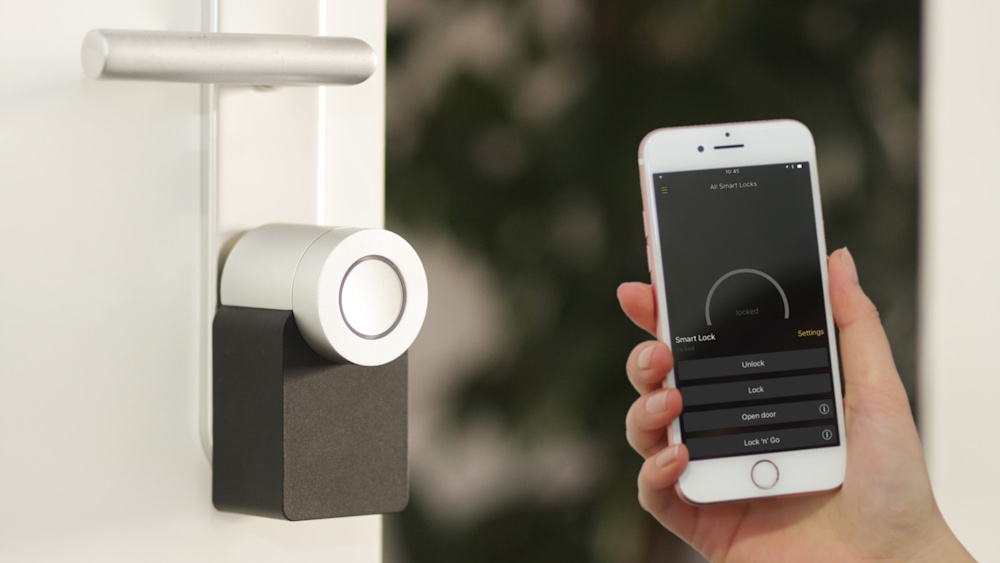

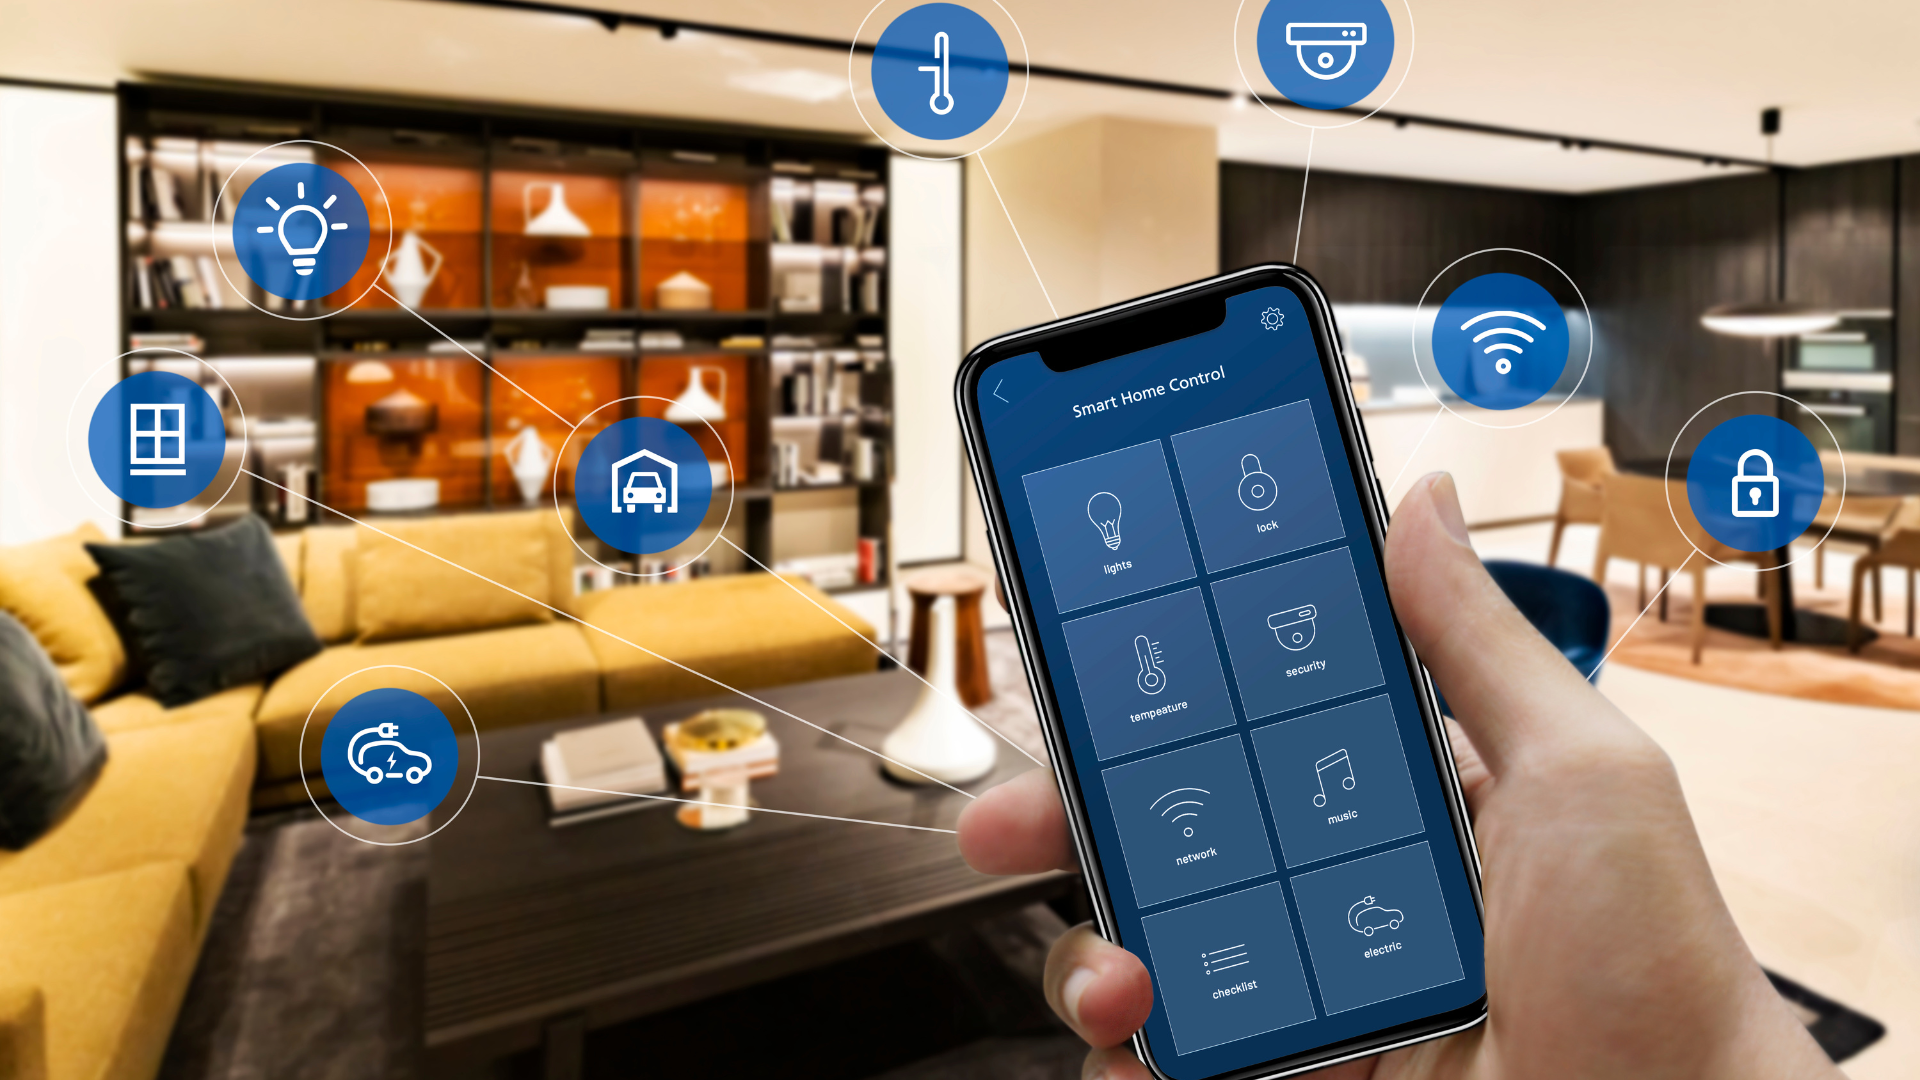
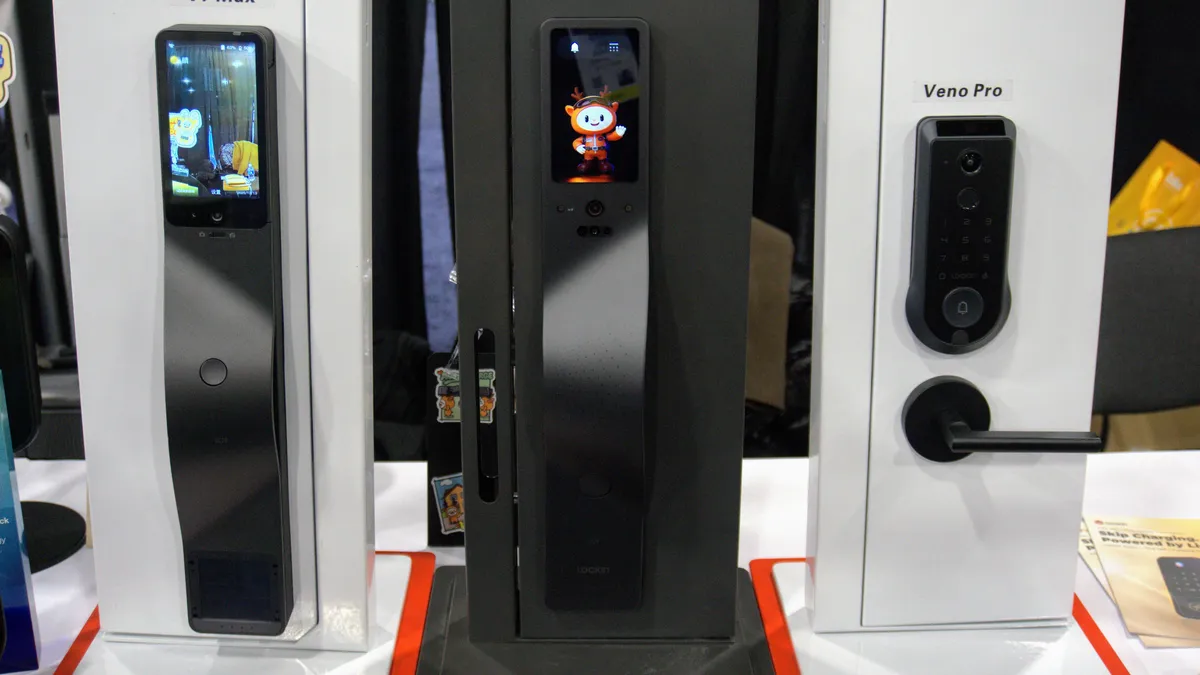


Tags
📧 Get More Articles Like This
Subscribe to receive product reviews and buying guides in your inbox!
We respect your privacy. Unsubscribe at any time.